An Analysis of the Top Tech YouTube Channels with Python

0 The YouTube API
Did you know that YouTube had an API? And did you know that this API can be used to get all the data you need for a cool data science project? Well, now you do. In this article we will demonstrate how to use it to get a rich dataset which will allow us to analyze and compare the top tech channels.
In order to be able to make requests to the YouTube API we need to follow these steps:
- Create a new project in your Google Developers Console – all you need is a Google account to do this
- Request an API key on the "CREDENTIALS" tab by clicking "CREATE CREDENTIALS"
- Enable the YouTube API service by clicking on "ENABLE APIS AND SERVICES" on your dashboard then search and tick the "YouTube Data API v3"
And we are now ready to call the API to get our data.
A more detailed version of these explanations are available on Google documentation if necessary:
Now that we have everything we need, let's get coding!
In this article we will:
- Get a channel basic information (creation date, description, number of videos, number of subscribers, …)
- Get all video details of this channel (title, description, duration, views, likes, …)
- Do this for the 5 channels we want to investigate
- Build some (interesting) analyses around this data
In order to kick start our project, we first need to install the google api client library (pip install google-api-Python-client) and import the 2 libraries we will use throughout (pandas and the google api client library). We also store our API key and build this youtube object which will allow us to make the API calls, as described in the code below.
import pandas as pd
from googleapiclient.discovery import build

# API configuration
api_key = 'YOUR API KEY FROM STEP 0'
YouTube = build('youtube', 'v3', developerKey=api_key)
And now we are good to go, for real.
#1 Get MKBHD channel basic information
The Google documentation is well organized and easy to navigate, with each endpoint having its own section:
In this section we are using the channels endpoint.
All we need really is the channel id of the YouTube channel we consider. Here I'm focusing on the MKBHD channel. The channel id used to be very visible in the channel page url, but it's no longer the case. However, looking for "channel_id" in the source code of the page works as well:

Once we have the channel_id, we can call the API to get the channel overview data as a JSON. The idea is to get, from that JSON, only what's relevant to us and store this in a DataFrame as shown below:
# Youtube Channel ID
mkhbh_id = 'UCBJycsmduvYEL83R_U4JriQ'

# Put channel overview in a DataFrame
request = youtube.channels().list(part="snippet,contentDetails,statistics", id=mkhbh_id)
response = request.execute()

channel_overview = {
    'title' : response['items'][0]['snippet']['title'],
    'description' : response['items'][0]['snippet']['description'],
    'publishedAt' : response['items'][0]['snippet']['publishedAt'],
    'viewCount' : response['items'][0]['statistics']['viewCount'],
    'subscriberCount' : response['items'][0]['statistics']['subscriberCount'],
    'videoCount' : response['items'][0]['statistics']['videoCount'],
    'uploads' : response['items'][0]['contentDetails']['relatedPlaylists']['uploads']
}

df_channel_overview = pd.DataFrame([channel_overview])
df_channel_overview
And this is the result:

We now have the overview of MKBHD channel (title, description, creation date, view count, sub count and video count) nicely stored in a DataFrame.
The "uploads" variable is key to access the list of videos of the channel later on.
2 Get all video details of MKBHD channel
In this section we are using the playlistItems and videos endpoints.
- The playlistItems endpoint ** will allow us to get all the video IDs from the "uploads" variabl**e described above.
- The videos endpoint ** will allow us to get all the video details from the video ID**s.
The code below does the first part. I stored the "uploads" variable in what I called the "playlistId" which just makes more sense to me.
Every request to the playlistItems endpoint gives a maximum of 50 video IDs. If the channel has more than 50 videos, we need to make multiple requests.
Each response will contain a "nextPageToken" if there are more video IDs to get. So the idea here is to make a first request to the API, add the video IDs in a list and check if there is a "nextPageToken". If so, then we start a while loop which does the same request again until there is no more "nextPageToken", meaning we got to the end and there are no more video IDs to get.
# Get all the video IDs from the channel and put them in a list
playlistId = df_channel_overview['uploads'].iloc[0]
video_ids = []

request = youtube.playlistItems().list(part="snippet,contentDetails", playlistId=playlistId, maxResults = 50)
response = request.execute()
nextPageToken = response.get('nextPageToken')

for item in response['items']:
    video_ids.append(item['contentDetails']['videoId'])

while nextPageToken is not None:
    request = youtube.playlistItems().list(part="snippet,contentDetails", playlistId=playlistId, maxResults = 50, pageToken = nextPageToken)
    response = request.execute()
    nextPageToken = response.get('nextPageToken')
    for item in response['items']:
        video_ids.append(item['contentDetails']['videoId'])
Now that we got all the video IDs from MKBHD in a list, we can use the videos endpoint to get more details about these videos. We'll store all this in a DataFrame thanks to the code below:
# Put video details in data frame
videos = []

for i in range(0, len(video_ids), 50):
    request = youtube.videos().list(part="snippet,contentDetails,statistics", id=video_ids[i:i+50])
    response = request.execute()

    for item in response['items']:
        video = {
            'channelTitle' : df_channel_overview['title'].iloc[0],
            'videoId' : item['id'],
            'categoryId' : item['snippet']['categoryId'],
            'publishedAt' : item['snippet']['publishedAt'],
            'title' : item['snippet']['title'],
            'description' : item['snippet']['description'],
            'tags' : item['snippet'].get('tags','no_tags'),
            'duration' : item['contentDetails']['duration'],
            'viewCount' : item['statistics'].get('viewCount',0),
            'likeCount' : item['statistics'].get('likeCount', 0),
            'commentCount' : item['statistics'].get('commentCount',0)
        }
        videos.append(video)

df_videos = pd.DataFrame(videos)
df_videos
The idea is similar as what we explained in the latter section. The API won't respond with more than 50 videos per page, so we split our video IDs list into blocks of 50 and build a for loop.
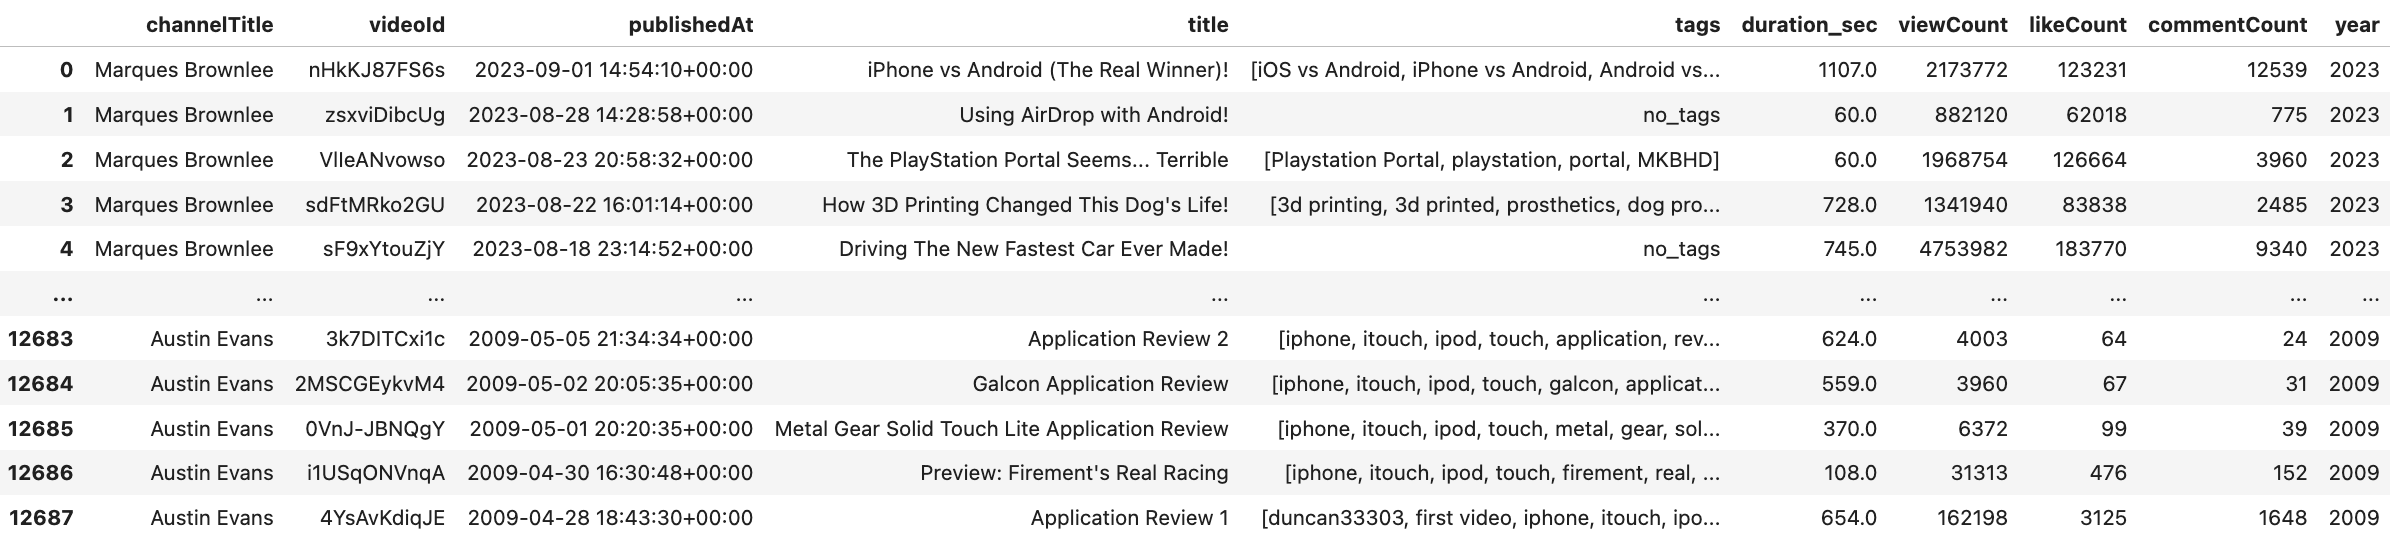
And there we have it. All the video details, stored in a nicely formatted DataFrame!

You might notice that the "duration" column uses an unusual format. Let's translate it to seconds, and do a bit cleaning:
import isodate
# Convert duration column to seconds
df_videos['duration_sec'] = df_videos['duration'].apply(lambda x: isodate.parse_duration(x).total_seconds())

# Convert specific columns to numeric type
numeric_columns = ['viewCount', 'likeCount', 'commentCount', 'duration_sec']
df_videos[numeric_columns] = df_videos[numeric_columns].apply(pd.to_numeric, errors='coerce')

# Convert column to Datetime to access the year
df_videos['publishedAt'] = pd.to_datetime(df_videos['publishedAt'])
df_videos['year'] = df_videos['publishedAt'].dt.year
And we're done.
At the end of this section, we now have 2 DataFrames for a specific channel:
- df_channel_overview – containing the overview info of the channel
- df_videos – listing all the videos of the channel
#3 The 5 Youtube channels
The only thing left to do is to loop over the different channel IDs of the channels we want to consider in our analysis to get the df_channel_overview DataFrame and the df_videos DataFrame populated with all their data.
The 5 tech channels we're considering in this project are:
- MKBHD
- Unbox Therapy
- Linus Tech Tips
- Dave 2D
- Austin Evans
And finally, this is what our 2 data sets look like:
1- df_channel_overview

2- df_videos
Now, let's build some nice looking graphs based on all this!
4 Channels analysis and comparison
There are already some interesting insights to unravel from the overview data of the 5 channels.

The graph above shows that Linus Tech Tips has by far the highest number of videos and views, however it's MKBHD who averages more views per video, closely followed by Unbox Therapy.
The "videos" DataFrame allows us to go deeper and the number of videos released every year tells an interesting story. We can exclude 2023 from the conclusion as the year is not finished, hence the dip in the graph below.

It looks like MKBHD, Austin Evans and Dave 2D found their cruising pace for many years, averaging about 100 videos per year. Unbox Therapy on the other hand ramped up its video production in 2016 to 200+ videos a year, before slowly getting back to 100 in 2022. Maybe it's too much work? Well, not for Linus Tech Tips which releases between 400 and 500 videos per year!
Making a lot of videos is great, but how do they perform in terms of views?

The average number of views per video as a function of the video release year gives an indication about the trend each channel is following. But there's a catch. If I watch, in 2023, a video released in 2020, this view will be shown on the graph above in the year 2020. So this does not really show the views of the channels over time, but rather the views per videos in their release year.
It's good enough to notice though, that the videos MKBHD makes since 2017 average between 4M and 5M views, whereas Linus Tech Tips averages between 2M and 2.5M views per video released in the same period.
Unbox Therapy peaked in 2018 but is trending downward ever since.
What about video duration? Is there a correlation between how long a video is and how many times it is viewed?

It's hard to tell by just plotting the scatter plots but there is no clear cut. It does not seem to be a correlation at all. However, according to the following graph, not all video creators adopted the same strategy in terms of video duration.

MKBHD and Unbox Therapy are now producing shorter videos, as opposed to Linus Tech Tips who is not only creating more videos, but also longer ones. This could be due to some channels now releasing "shorts" which would lower the average duration of videos for a given year.
5 Conclusion
This article only touches on some aspects of the analyses that could be done with these very rich datasets.
Other analysis ideas might include:
- Investigating the correlation between likes and views (or comments and views).
- Isolating "shorts" which appeared on YouTube in 2021 and see how they perform compared to regular videos.
- Figuring out what the optimum strategy is in terms of balancing "shorts" and regular videos.
This goes to show that understanding APIs and how they can be leveraged to pull data from platforms can contribute to the development of some great data science projects!
Thanks for reading all the way to the end of the article. Follow for more! Feel free to leave a message below, or reach out to me through LinkedIn / X if you have any questions / remarks!
