Bigram Word Cloud Animates Your Data Stories

Animated Word Cloud displays n-gram frequencies (words and consequent words in a text corpus) over time as a sequence of images in a video file. ** It gives greater importance to words that appear more frequently in a source text, but it scales the dataset to work with different datasets. The original visualization method uses the intuitive logic of classic word clouds and adds a time dimension to the graph. It has been designed to explore text datasets collected over multiple periods (referred to as __ "time-series text data"**).
Michael Kane developed the core framework for animating word frequencies, and the AnimatedWordCloud (AWC) library implemented the visualization method into practice. __ The new release brings important updates:
- data scaling: it now works better with text datasets of different sizes and word frequencies
- extending the _ngram parameter ( = 2) to generate bigram word clouds
- efficiency improvements (saving now 220 frames for each period, improved Y axis, etc.).
This article will give a glimpse of how to create a bigram-animated word cloud from a text dataset of product reviews. Read my main framework and unigram tutorials to learn more about animated word clouds.
2. Use cases
Earlier releases of the AWC were already used to tell the stories of:
- Economic research trends: research published in A-class Economics journals since 1900.
- European Central Bank (ECB) communication: public speeches of economists and researchers of the ECB since the Eurozone launch.
3. Bigram Animated Word Cloud
3.1. How to install the library
Install the library in a new Python 3.8 virtual environment to avoid dependence conflicts. It relies on Python 3.8 because of its visualization requirements. To install using pip, use:
pip install AnimatedWordCloud3.2. Data
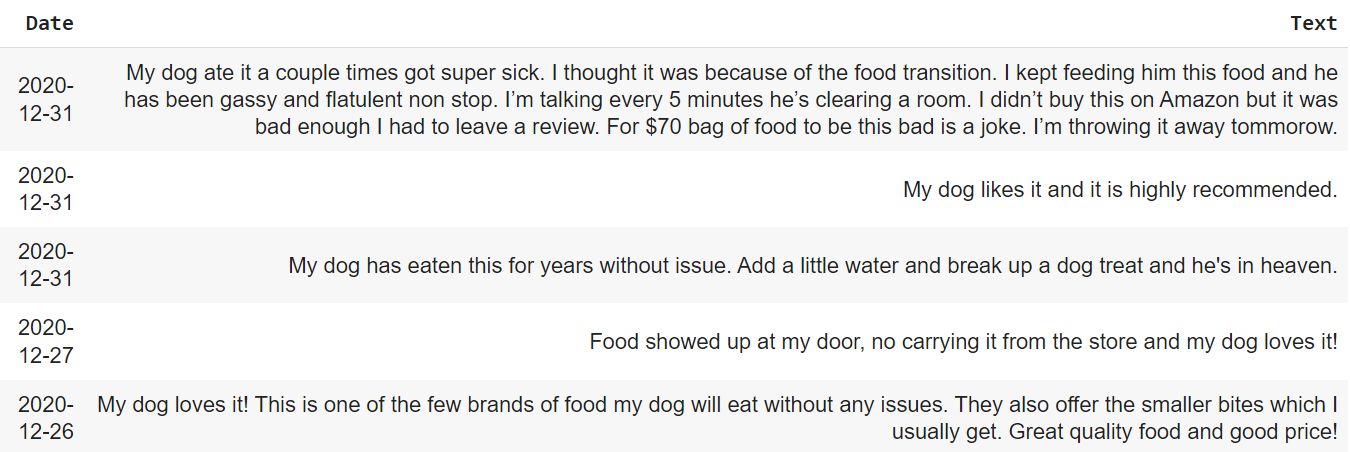
For the AWC bigram exercise, we'll use the Amazon Dog Food Reviews dataset from the Hugging Face, released under the Apache-2.0 license. The example subset covers 305 reviews from 2020-01-01 to 2021-04-16 and can be downloaded from here.
Here is what the data looks like:
3.3. Product review analysis
Product reviews are very useful sources of information for companies because they contain qualitative information about the customers' satisfaction with products (or services).
Text Mining analysis can reveal bigrams with positive and negative meanings, and also bigrams that indicate important factors of product satisfaction. Read my previous TDS article about customer satisfaction measurement with n-gram and sentiment analysis to learn more.
Finding a high frequency of bigrams with positive meanings, e.g., "highly satisfied", "fast delivery," or "great service" and bigrams with negative meanings, e.g., "poor quality" or "damaged products" might indicate import problems hampering the company's growth.
Now, let's generate a Bigram animated Word Cloud for the text reviews in monthly frequency, cleaning data from English stopwords and also cutting out other redundant strings (‘years old', ‘year old', ‘every day', ‘Amazon'):
The code creates 200 PNG word cloud images per period. The frames are stored in the working directory in the newly created _.postprocessing/frames folder.
Next, download the ffmpeg folder and the frames2video.bat file from here and place them into the postprocessing folder. Running the frames2video.bat generates a wordSwarmOut.mp4 video file. The video is on my YouTube:
The brand associated with the reviews appears to be Blue Buffalo. We can see large frequencies of bigrams with positive meanings – "dog loves", "dog likes", and "love food" until Oct 2020. The associated qualities are price ("good price") and product quality ("life protection").
Since Dec 2020, there seem to be negative health effects of the products ("bloody vomit", "vomit stool," "heart disease," "vomiting diarrhea"). In this situation, the company should check the production line and the delivery process to find out the reasons.
Conclusions
Animated Word Cloud is an original text visualization method for datasets with time variability. The library is a result of applied text-mining research. Originally developed by Michael Kane, the Python implementation relies on the preprocessing of the Arabica library, which is now forthcoming in the Journal of Open Source Software (Koráb, Poměnková, 2024).
The library is still under development. Let's mention several drawbacks of using the AWC for time-series text visualization:
- Every video generation is a random visualization exercise. This means that:
Color, word positions, and other parameters are generated for each trial. In certain trials, the words might overlap, lowering the quality of the data story. Therefore, it is helpful to create a couple of videos, compare the visuals, and select the nicest one.
- The video keeps relative differences in n-gram frequencies over the whole time period. However, it is scaled by several constants to work with different types of text datasets.
The library has been tested and optimized to work with datasets of various sizes, periods, and word frequencies, but it is still under development. If you find any visualization issues that hamper the video quality, please open an issue here to get it improved.
- The skip parameter cuts out raw strings but not tokens. Consider adding another preprocessing step if the text dataset is just too noisy.
Skip removes strings as they are and does not consider tokenization of the dataset. Removing strings such as "Mar" might lead to a bias because a bigram "Mario Braghi" then might become "io Braghi". In practical situations, it is useful to use the skip parameter to remove complicated strings such as: skip = ['https://1236578995.org/@789', '@JaayZen/']
If you enjoy my work, you can invite me for coffee and support my writing. You can also subscribe to my email list to get notified about my new articles. Thanks!
References
[1] Koráb, & Poměnková. (2024). Arabica: A Python package for exploratory analysis of text data. Journal of Open Source Software, 9(97), 6186. https://doi.org/10.21105/joss.06186.
