Demystifying Dependence and Why it is Important in Causal Inference and Causal Validation

Introduction
Causal Inference is an emergent branch of data science concerned with determining the cause-and-effect relationship between events and outcomes and it has the potential to significantly add to the value that machine learning can generate for organisations.
For example, a traditional machine learning algorithm can predict which loan customers are likely to default thereby enabling proactive intervention with customers. However, although this algorithm will be useful to reduce loan defaults, it will have no concept of why they occurred and whilst pro-active intervention is useful knowing the reasons for defaults would enable the underlying cause to be addressed. In this world pro-active intervention may no longer be necessary because the factors that lead to defaulting have been permanently cured.
This is the promise of Causal Inference and why it has the potential to deliver significant impact and outcomes to those organisations that can harness that potential.
There are a number of different approaches but the most common approach typically starts by augmenting the data with a "Directed Acyclic Graph" which encapsulates and visualises the causal relationships in the data and then uses causal inference techniques to ask "what-if" type questions.
The Problem
A Directed Acyclic Graph (DAG) that encapsulates the causal relationships in the data is typically constructed manually (or semi-manually) by data scientists and domain experts working together. Hence the DAG could be wrong which would invalidate any causal calculations leading to flawed conclusions and potentially incorrect decisions.
The Opportunity
A range of techniques exist for "Causal Validation" (the process of validating the DAG against the data) and if these techniques work they can minimise or eliminate errors in the DAG thereby ensuring that the calculations and conclusions are error-free.
The Way Forward
The statistical concept of dependence between random variables can be used to ascertain whether a relationship that exists in the DAG also exists in the data; if it does exist the DAG is more likely to be correct and if not it is more likely to be incorrect.
Getting Started
We are going to need an example DAG to work through the problem which has enough nodes and links to enable a deep exploration of causal validation …
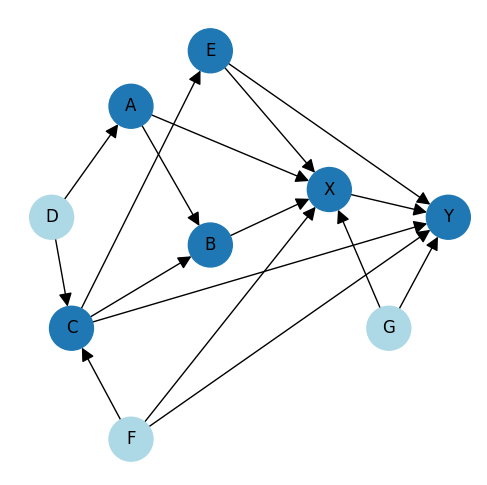
Each node in a DAG is either having a causal effect on other node(s) or other node(s) are having a causal effect on it and the direction of the arrow is the direction of the causal effect. For example, one of the causes of "B" is "C" and one of the causes of "C" is "F".
The example DAG is fictitious hence the node letters / names are unimportant, however "X" is intended to be the "treatment", "Y" is the "effect," and all the other nodes are having some causal impact that would, in a real-world example, obscure the true effects of X on Y.
Note that the light-blue nodes have no inputs (exogenous in causal terminology) and the dark-blue nodes have one or more inputs (endogenous in the terminology).
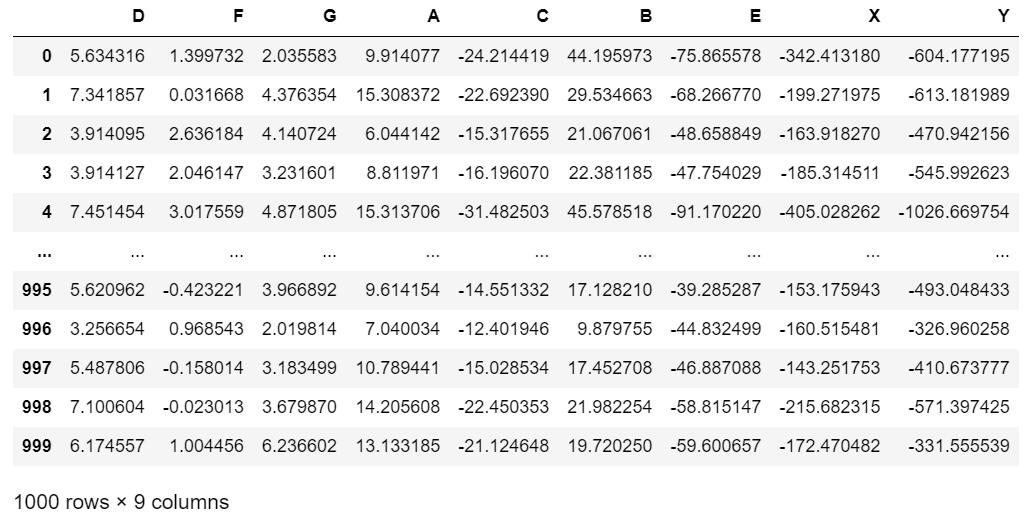
To get started we will also need some data that matches the DAG. The dataset below is entirely synthetic and has been generated by the author. It exactly encapsulates and matches the structure suggested by the DAG and contains no erroneous or faulty relationships …
Another thing we need before we can get started is a way of extending the pandas DataFrame and Series classes with custom methods so that the code we write is clean, concise and easy to understand.
Here is a link to one of my previous articles that provides an end-to-end tutorial on how to extend data frames and why it is a useful thing to do …
How to Extend Pandas DataFrames with Custom Methods to Supercharge Code Functionality & Readability
Understanding Dependence
One definition of dependence is as follows …
Dependence between two random variables means that the occurrence or value of one variable affects the occurrence or value of the other. Variables are considered dependent if the occurrence or value of one variable provides information about the occurrence or value of the other variable.
To unpack this, let's take another look at our example DAG and consider the causal factors that affect node Y …

In this visualisation we can see that node Y is caused by (and hence dependent on) 5 different factors – C , E , F , G and X.
Now lets take another look at the data that the DAG is representing …
This synthetic data set was created by the author to facilitate the article so I happen to know that the relationship between node Y and those dependent factors is as follows …
Y = 3C + 3E + 2F + 2.5G + 1.5X + ε
(Note: ε represents the error term)
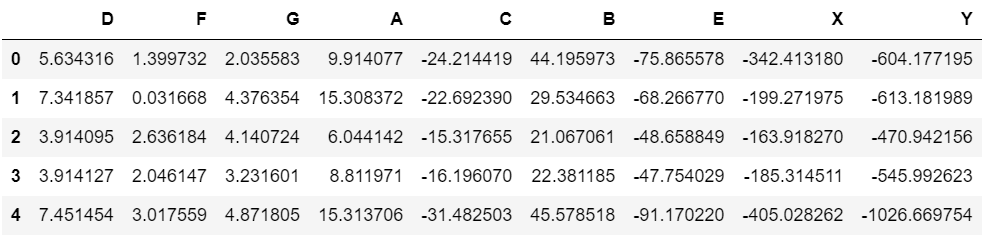
… and this can be tested and verified by picking a row (in this case I have chosen the 3rd row) applying that formula to the data …
Y = -422.1827393983049, error term = 48.75941612372628We can now see why and how Y is dependent on C, E, F, G and X. If the value of one of those dependent variables changes, the value of Y will also change. We can also see from the DAG that Y should not be dependent (for example) on node D because there is no link between D and Y.
The statement "Y is dependent on C, E, F, G and X" can be represented in a mathematical formula as follows …
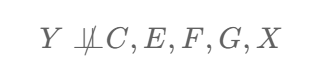
… and the statement "Y is independent of D" is represented as follows …

The ⫫ symbol is called a "double up-tack" but the ⫫̸ symbol does not have a commonly accepted name so I have adopted "slashed double up-tack" through personal preference.
Some articles and texts use a single up-tack (⊥ and ⊥̸) instead of double up-tacks but double up-tacks are more common hence that is the standard that I have adopted and used throughout this article and the associated Python code.
To recap then, statistical dependence between two random variables means that "the occurrence or value of one variable affects the occurrence or value of the other" and we now know how this looks visually in the DAG, how to represent it as a mathematical formula (e.g. Y = 3C + 3E + 2F + 2.5G + 1.5X + ε) and also how to represent it using the slashed double up-tack notation (e.g. Y ⫫̸ C, E, F, G, X).
From Dependence to Causal Validation
Causal Inference typically starts with a set of data and then augments that data with a DAG. There are emerging techniques that can reverse engineer a DAG from the data but they are not accurate or consistent hence the most common approach to developing a DAG is to ask the domain experts what they think the causal relationships are and then to validate or test that DAG against the data and amend it as necessary if validation fails.
The DAG has proposed that Y is dependent on C, E, F, G and X and if this dependency exists in the data then there will be confidence that the causal links pointing into node Y are valid and correct and there is a mathematical notation that can be used to represent this as follows …
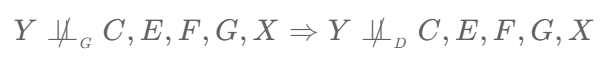
This scary-looking formula is actually very simple to understand. The "G" subscript of the first slashed double up-tack dependency symbol means "in the graph" (i.e. the DAG) and the second "D" subscript means "in the data" (note that I have seen a "P" subscript in some of the literature but "D" makes more sense to me so that is what I have adopted).
Armed with that knowledge, the whole formula can be read as "If Y is dependent on C, E, F, G and X in the graph then Y should also be dependent on C, E, F, G and X in the data.
It follows then that we just need a mechanism in Python that can detect dependencies in the data. That mechanism can then be used to check each node in the DAG that has in-coming connections and if dependencies are detected in the data that match those in the DAG we can be reasonably confident that there are no spurious connections (causal links) and that the DAG is a valid representation of the data in this respect.
Observing Dependence in the Data
Let's start by visualising the relationships that exist in the data between C, E, F, G and X and our node of interest Y …
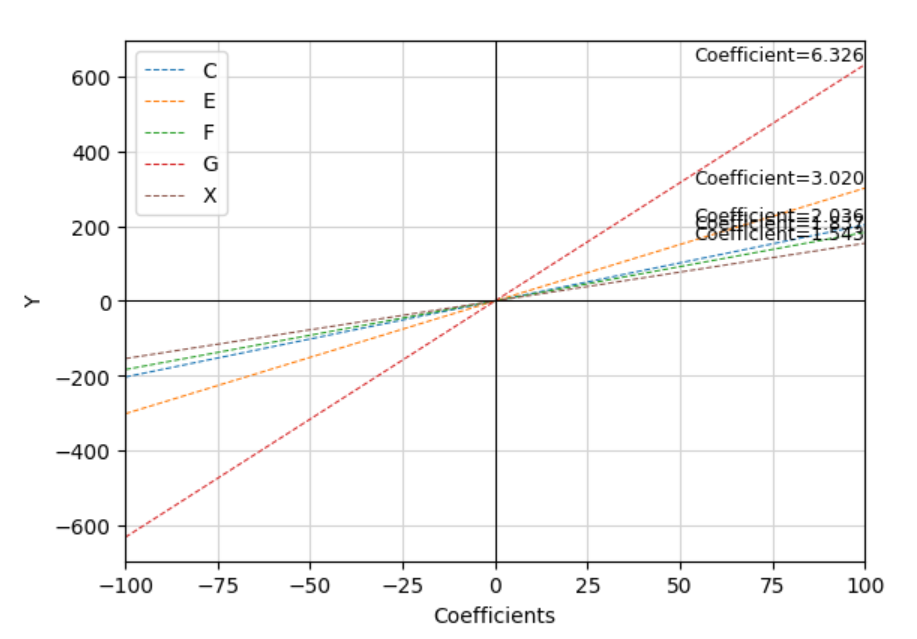
The chart on the right is plotting Y on the x axis and separate lines for C, E, F, G and X on the y axis. If Y is dependent on these other variables then changing the value of one of them should change the value of Y. This means that there should be a positive or negative co-efficient and the lines should exhibit a noticeable slope (either upwards or downwards).
Given that there are definite slopes we can see that
