How to Forecast Hierarchical Time Series
Imagine you're a data scientist at a charming little pet shop specializing in just five products: two varieties of cat food and three types of dog food. Your mission? To help this small business flourish by accurately forecasting the weekly sales for each product. The goal is to provide a comprehensive sales forecast – total sales, as well as detailed predictions for cat food and dog food sales, and even individual product sales.
The Data
You have data on the sales of the different types of cat food A and B, as well as the different types of dog food C, D, and E for 200 days. Lucky for us, the data is exceptionally clean, with no missing values, and no outliers. Also, there is no trend. It looks like this:

Note: I generated the data myself.
In addition to the individual sales, we also have the aggregated sales for all cat food products, all dog food products, and all products. We call such a collection of time series hierarchical time series. In our case, they respect the following sales hierarchy:

The individual sales A, B, C, D, and E are at the bottom of the hierarchy, the total sales are at the top.
This structure translates to the following equations:
- sales_cat_A + sales_cat_B = sales_cat,
- sales_dog_C + sales_dog_D + sales_dog_E = sales_dog,
- sales_dog + sales_cat = sales_total.
So far so good.
Modeling
Now, the idea is to train a model for each of the eight time series and call it a day. You train the model on the first 140 days and try to predict the remaining 60. You want to produce forecasts for the next 60 days as well. After playing around it a bit, this is what you came up with (using exponential smoothing with an additive trend):
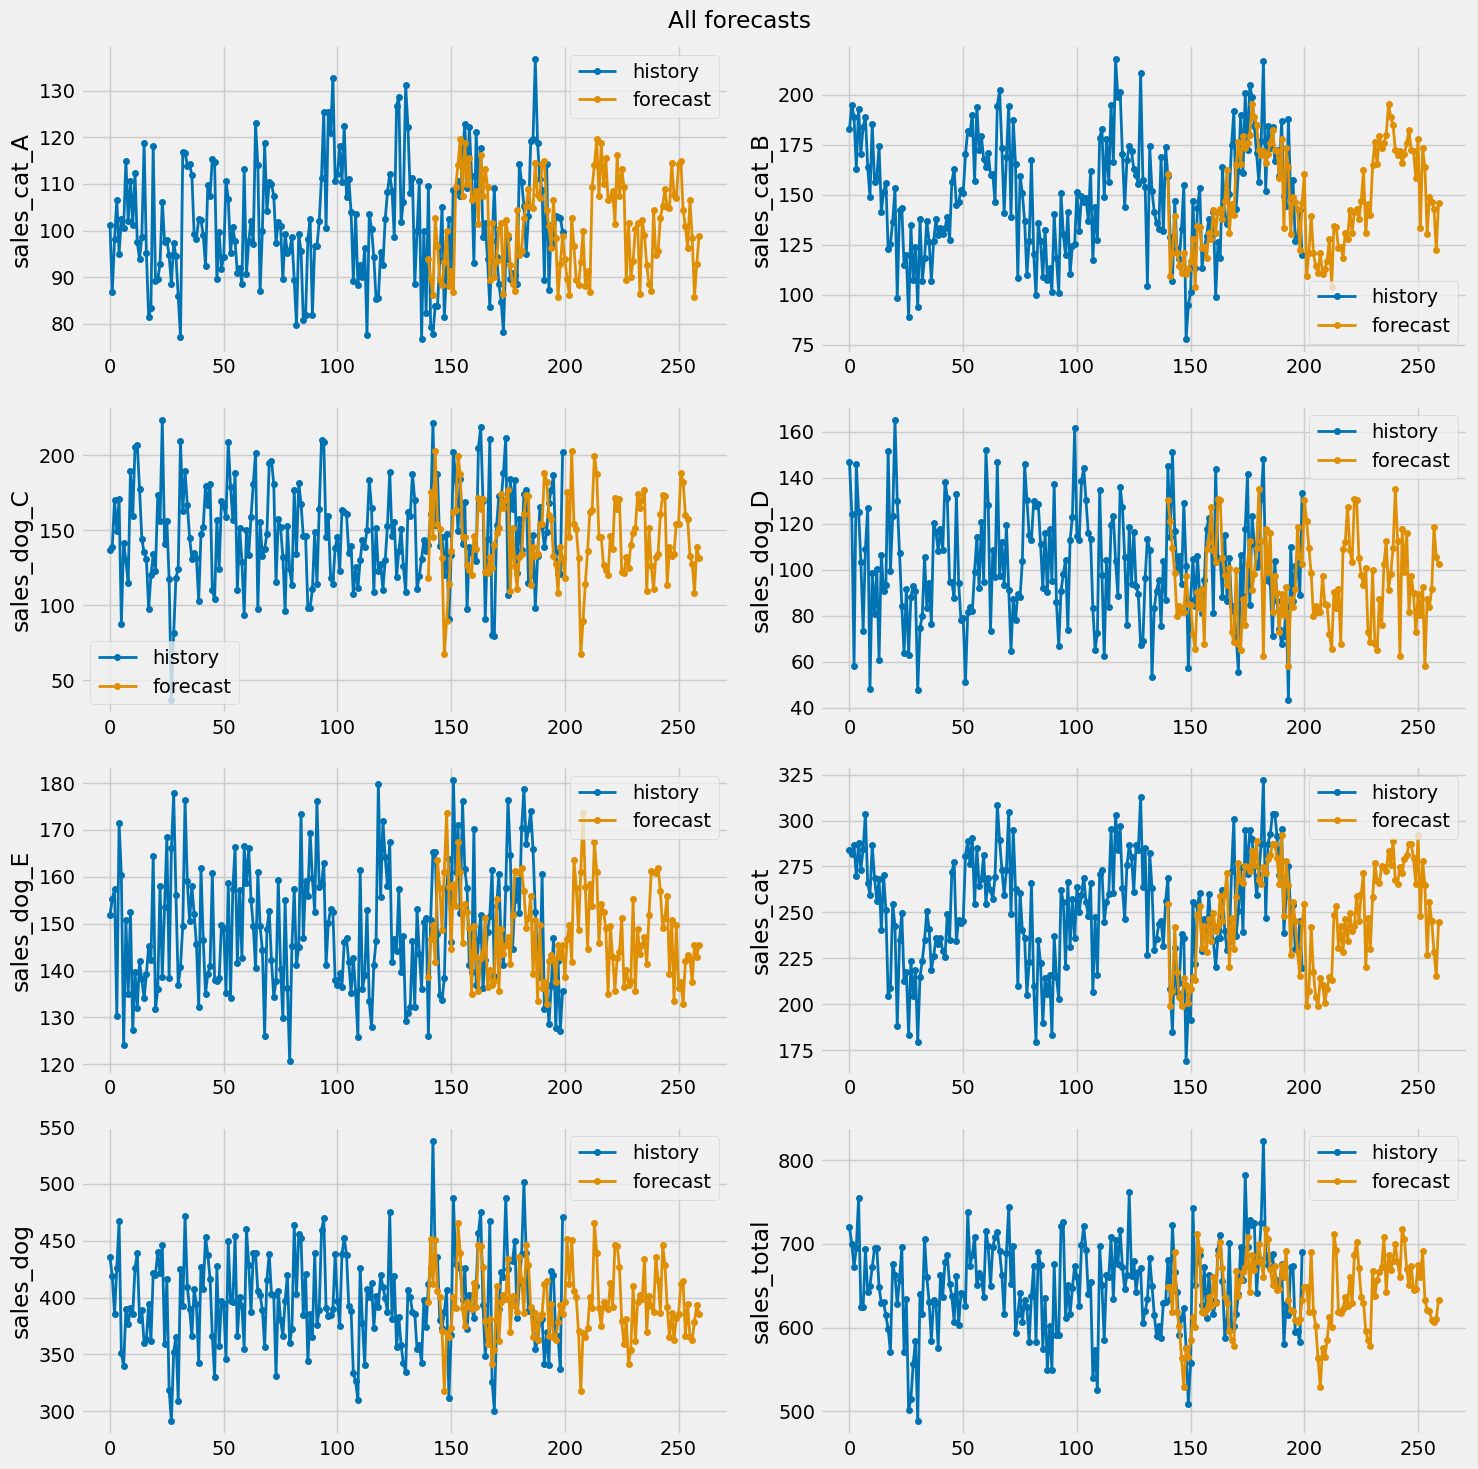
The performance on the test set (days 140–200) looks quite good, so you decide to send the forecasts for days 200–260 to your stakeholders. But a day later, you receive the following message:
"Hi, thanks again for these awesome forecasts! But there is something weird about them: Somehow they don't add up. For example, if I add the predicted sales of products A and B, I don't get the predicted sales of the whole cat food category. Can you please look into that again?" – Bob
Sweating, you look at the first few rows of your produced outputs:

You calculate the first row in the cat food category by hand: 93.85 + 160.42 = 254.27, but the direct model for sales_cat says 254.45, which is only 0.18 off, but still, it is not the same. Which numbers should you trust now?
Note: Often, when the time series are harder to learn, and the numbers get bigger, you can also be off by a few thousand or even worse.
Forecast Reconciliation
Oh damn, that makes sense from a technical perspective. You have just trained eight independent time series, so it would have been a miracle if they magically added up to one another. But don't despair, there is a quite simple technique to save the day: forecast reconciliation!
The goal is to adjust the outputs that you have just created in a way that they respect the hierarchy again. The goal:
Individual cat food product sale forecasts add up to the cat food sale forecast. Individual dog food product sale forecasts add up to the dog food sale forecast. Last but not least, cat and dog food sales forecasts add up to the total sales forecast.
Forecast reconciliation sounds complicated, but it is a technique that comes in many flavors, some of which are very simple to understand and implement. Let us start with the easiest one.
Bottom-Up
The natural thing to do for me is to only forecast the individual product sales of A, B, C, D, and E – the bottom forecasts – and then add them up according to the hierarchy to create the forecasts of the higher levels.
So, basically:
- sales_cat_forecast := sales_cat_A_forecast + sales_cat_B_forecast,
- sales_dog_forecast := sales_dog_C_forecast + sales_dog_D_forecast + sales_dog_E_forecast,
- sales_total_forecast := sales_dog_forecast + sales_cat_forecast.
This also means that you only have to train five models instead of eight. So, you can take your individual product forecasts again and just add up a bunch of columns.

Now, you can add a column sales_cat by just summing sales_cat_A and sales_cat_B. Doing the same for sales_dog and finally sales_total, you create bottom-up reconciled forecasts:

Per definition, your forecasts respect the hierarchy now!
