Making Your Data Analytics Come to Life using ipywidgets

For my daily Data Analytics tasks, my favorite development environment is definitely Jupyter Notebook. Jupyter Notebook allows me to quickly modify my code and re-run the cell(s) to see the updates. However, this feature is not friendly to users who are using my Jupyter Notebook to view the results of my data analytics. It would be really useful if there is a way for users to interact with my program without the need to modify the code. This is where the ipywidgets package comes in.
ipywidgets is a package that contains interactive HTML widgets for Jupyter Notebook. Using the widgets in ipywidgets, your Jupyter notebooks will come alive and users can directly control their data and visualize the changes in their data. In this article, I will walk you through the process of using ipywidgets together with your dataset.
Installing ipywidgets
In your Jupyter notebook, install the Ipywidgets and widgetsnbextension packages as follows:
!pip install ipywidgets widgetsnbextensionThen, enable the widgetsnbextension as follows:
!jupyter nbextension enable --py widgetsnbextension --sys-prefixUsing the interact function
For our examples, I am going to use the insurance dataset located at https://www.kaggle.com/datasets/teertha/ushealthinsurancedataset?resource=download.
License: CC0: Public Domain. Description – This dataset contains 1338 rows of insured data, where the Insurance charges are given against the following attributes of the insured: Age, Sex, BMI, Number of Children, Smoker and Region. The attributes are a mix of numeric and categorical variables.
Let's first load the CSV file into a Pandas DataFrame:
import pandas as pd

df = pd.read_csv('insurance.csv')
df
Slider widgets
Let's say I want to retrieve all the rows containing 3 children. I could do something like this:
df.query(f'children == 3')
If I want to retrieve rows with 4 children then I have to modify my statement and rerun the cell. Obviously, this is not very productive.
This is where the interact function from the ipywidgets package comes in really handy:
from ipywidgets import interact

def f(children):
    display(df.query(f'children == {children}'))
In the above code snippet, I defined a function named f that takes in one argument – children. The function will query the dataframe and display the result. The next statement is where the magic happens:
interact(f, children = 5) The interact() function (ipywidgets.interact) automatically creates user interface (UI) controls (known as widgets) and binds them to your specified function. The above statement will generate the following output containing an IntSlider widget as well as the dataframe:

The value that you pass into the
childrenparameter will determine what kind of UI control is generated. Here, you are passing in an integer and so a slider control is generated. If you pass inn, it generates an integer-valued slider control with a range of [-n,+3*n].
Go ahead and drag the slider. As you drag, the dataframe will dynamically update.
We can do the same for the age field, but this time we want to set the range of age selectable:
def f(age):
    display(df.query(f'age > {age}'))

interact(f, age = (df['age'].min(), df['age'].max()))
The minimum age is 18 and maximum is 64. The current slider value will be displayed in the middle position – 41 (which is (18+64)/2).
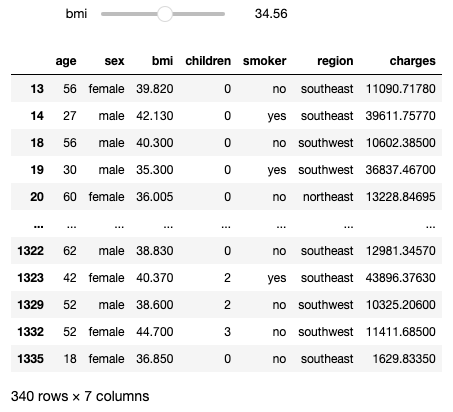
If you pass in a floating-point number, such as BMI:
def f(bmi):
    display(df.query(f'bmi > {bmi}'))

interact(f, bmi = (df['bmi'].min(), df['bmi'].max()))
Then a FloatSlider widget will be displayed:
DropDown widget
What about selecting the region? We can pass in the region as a list:
def f(region):
    display(df.query(f'region == "{region}"'))

interact(f, region = df['region'].unique())
You can now select one of the four regions using the DropDown control:

What if I want to select all regions? For this, you need to get creative. First, I will create a list of tuples containing the four regions:
regions = [(i.capitalize(),i) for i in df['region'].unique()]The above code snippet generates the following list:
[('Southwest', 'southwest'), ('Southeast', 'southeast'), ('Northwest', 'northwest'), ('Northeast', 'northeast')]The first element in each tuple is what is shown to the user. The second element is the value of the selected item.
Then, append a tuple – ('All Regions','@*'), to the list:
regions.append(('All Regions','@*'))The regions variable now looks like this:
[('Southwest', 'southwest'),
 ('Southeast', 'southeast'),
 ('Northwest', 'northwest'),
 ('Northeast', 'northeast'),
 ('All Regions', '@*')]
You can now pass the regions variable to the interact() function:
def f(region):
    display(df.query(f'region.str.contains("{region}")'))

interact(f, region = regions)
Note that I have to change my query statement to use the contains() function. You can now select the All Regions item to select rows from all regions:

CheckBox widget
When you pass in a boolean value to the interact() function, it will display a CheckBox widget. Consider the following example:
YES, NO = 'yes', 'no'

def f(smoker):
    display(df.query(f'smoker == "{YES if smoker == True else NO}"'))

interact(f, smoker = True)
The above code snippet displays a checkbox. Uncheck it and all non-smokers will be shown:

Text widget
Suppose you want the user to type in the region instead of selecting from a DropDown control. Easy, simply pass a string to the interact() function, like this:
def f(region):
    display(df.query(f'region.str.contains("{region}")'))

interact(f, region = "")
You will now see a text box where you can type in the region:

There is one issue. Observe that as you type, the dataframe is automatically updated. This feature is known as continuous update. For large dataframe this will pose a problem as everytime you change the content of the text box it will re-query the dataframe, which can be time consuming.
You can disable continuous update by explicitly specifying the Text widget (control) and then setting the continuous_update parameter to False:
from ipywidgets import widgets

def f(region):
    display(df.query(f'region.str.contains("{region}")'))

interact(f, region = widgets.Text('', continuous_update = False));
The dataframe will now update after you have typed in your query and press the Return/Enter key:

RadioButtons widget
Radio buttons are another way for users to select from a predetermined list of possible values. For our dataset, you can use it to let users select between smokers and non-smokers:
def f(smoker):
    display(df.query(f'smoker == "{smoker}"'))

interact(f, smoker = widgets.RadioButtons(options=["yes", "no"], value="no"));
For radio buttons, you need to manually specify the
widgets.RadioButtons()class.
The above code snippet shows the set of radio buttons to select smokers and non-smokers:

Using the Interactive Function
Up till this point, so far so good. You had the ability to create and use individual widgets to filter different fields in the dataframe. But what if you want to combine them all into one big filter? This is where the interactive() function comes in.
The interactive() function is similar to the interact() function, but it allows you to pass in multiple values to create multiple widgets. The following f() function takes in six arguments, which are passed in through the interactive() function:
from ipywidgets import interactive
import ipywidgets as widgets

report_output = widgets.Output()
display(report_output)

def f(age, bmi, children, region, sex, smoker):
    filtered = df.query(f'age >= {age} and bmi >= {bmi} and smoker == "{smoker}" and region.str.contains("{region}") and sex=="{sex}" and children=={children}')
    with report_output:
        report_output.clear_output()
        display(filtered)

regions = [(i.capitalize(),i) for i in df['region'].unique()]
regions.append(('All Regions','@*'))

interactive(f,
            age = (df['age'].min(), df['age'].max()),
            bmi = (df['bmi'].min(), df['bmi'].max()),
            children = (df['children'].min(), df['children'].max()),
            region = regions,
            sex = widgets.RadioButtons(options=["female", "male"], value="female"),
            smoker = widgets.RadioButtons(options=["yes", "no"], value="no"),
           )
Where the code snippet is run, you will see the following:

As you interact with the widgets, the dataframe is automatically updated. If you have a large dataframe, you may find that updating the dataframe every time a value in the control is changed is messy (your screen will refresh for all these little changes), and so it might be better to avoid refreshing the dataframe until the user wants to see the updated dataframe. To do so, insert a second argument ({'manual': True}) to the interactive() function:
interactive(f,
            {'manual': True},
            age = (df['age'].min(), df['age'].max()),
            bmi = (df['bmi'].min(), df['bmi'].max()),
            children = (df['children'].min(), df['children'].max()),
            region = regions,
            sex = widgets.RadioButtons(options=["female", "male"], value="female"),
            smoker = widgets.RadioButtons(options=["yes", "no"], value="no"),
           )
There will now be a button labelled Run Interact. You can change the values in the widgets and when you are ready to see the changes, click the Run Interact button and the dataframe will be updated.

If you like reading my articles and that it helped your career/study, please consider signing up as a Medium member. It is $5 a month, and it gives you unlimited access to all the articles (including mine) on Medium. If you sign up using the following link, I will earn a small commission (at no additional cost to you). Your support means that I will be able to devote more time on writing articles like this.
Summary
This article briefly touched on using the interact() and interactive() functions to generate widgets to bind to functions. Here is a quick summary of the type of widgets created based on the datatype you supplied:
- IntSlider or FloatSlider – when you pass in an numeric value, or a tuple of two numeric values
- DropDown – when you pass in a list of values (or a list of tuples)
- Text – when you pass in a string value
- CheckBox – when you pass in a boolean value (
TrueorFalse)
There are other types of widgets that require you to manually specify in the interact() and interactive() functions, such as RadioButtons and many others. In my next article, I will talk more about the other widgets that I did not have the chance to discuss in this article. Till then, have fun!
