The Ultimate Guide to Finding Outliers in Your Time-Series Data (Part 1)

If you are not a member of Medium, you can read the story here.
Outliers: those troublesome data points that can skew statistical models, distort forecasts, and undermine decision-making processes.
It's no wonder they're not particularly well-liked in data analysis.
My name is Sara, and I have a Master's degree in Physics. Currently, I work as a Data Scientist at a global energy company.
This article kicks off a four-part series dedicated to the identification and management of outliers in time-series data. If you're interested on following this series, make sure to follow me and subscribe to receive updates when the next parts are published!
In this initial piece, we explore both visual and statistical methods to identify outliers effectively in time-series data. This foundational knowledge is crucial for anyone looking to improve their analytical accuracy.
In the second article, I exclusively cover machine learning methods, given their significance and complexity, they deserve a dedicated discussion:
The Ultimate Guide to Finding Outliers in Your Time-Series Data (Part 2)
After finding the outliers, what should you do? The third article explores various strategies on how to manage these outliers, including removing, retaining and capping techniques, offering some practical ways to handle outliers:
The Ultimate Guide to Finding Outliers in Your Time-Series Data (Part 3)
In the fourth and last article I will continue to explore ways of managing outliers, focusing on imputation and transformation methods, as well as evaluating the impact of outlier treatment.
Hello there!
My name is Sara Nóbrega, and I am a Data Scientist specializing in AI Engineering. I hold a Master's degree in Physics and later transitioned into the exciting world of Data Science.
I write about data science, artificial intelligence, and data science career advice. Make sure to follow me and subscribe to receive updates when the next article is published!
Contents:
Part I (this article):
- Why should you care?
- Outliers vs Anomalies
- How to choose the right Anomaly Detection Method?
- Univariate vs Multivariate Time-series Data
- What are the Best Methods to Detect Outliers in your data?
- Visual Methods
- Statistical Methods
- Evaluation Metrics
Part II (Here):
3. Identification of Outliers
- Machine Learning Methods
- Evaluation Metrics
Part III (Here):
- Introduction: The Importance of Proper Outlier Treatment
- Assessing the Nature of Outliers
3. Special Considerations for Time-Series Data
- Basic Strategies for Handling Outliers
- Retaining
- Removing
5. Capping (Winsorization) for Outlier Treatment
- Setting upper and lower bounds
- Percentile-based capping
6. Alternative Capping Methods
7. Considerations and Best Practices
Part IV (Upcoming):
1. Transformation Techniques to Handle Outliers
- Log transformation
- Box-Cox transformation
- Other relevant transformations
2. Imputation Methods
3. Evaluating the Impact of Outlier Treatment
- Before and after comparisons
- Sensitivity analysis
Why should you care?
If you are reading this article, you probably know how critical it is to treat outliers before any modeling can be performed.
Some reasons why you should care about outliers in your time-series data:
- Outliers can significantly skew and misrepresent the key statistics of a dataset, such as the mean, variance, and correlation coefficients.
- Outliers compromise the performance of predictive models.
- Outliers can mask true trends and cyclic behavior in your time-series data.
- Decisions based on data that has not been critically examined for outliers can lead to poor strategic decisions.
There are many more reasons why dealing with outliers in time-series data is crucial for an effective analysis, but these should be enough reasons to motivate us to start exploring.
Btw, if you work with time-series data, you need to check the article below:
Outliers vs Anomalies
I will use the terms "anomaly" and "outliers" interchangeably, but there are subtle differences in their definitions. Anomalies can refer to any data point that deviates from the norm, while outliers specifically denote extreme values that lie far away from the majority of the data points. Many methods can be applied to both anomalies and outliers.
Btw, I wrote about a novel anomaly detection method that I developed, feel free to check it out!
How to choose the right Outlier Detection Method for Time-Series Data?

Selecting an optimal anomaly detection method for time-series data begins with a deep understanding of the dataset and anticipated anomalies.
That being said, start by considering the size of your dataset and the available computational resources.
For datasets where interpretability is key, simple methods such as the Z-Score and Moving Average might be ideal. However, more complex scenarios, like those requiring the detection of subtle patterns, may benefit from advanced techniques like LSTM networks (that will be covered on the second part of this series), which demand significant data and computational power.
Remember: Dataset size, computation resources, interpretability and the nature of your task are key to choose the appropriate outlier detection methods.
It can be beneficial to experiment with various methods and metrics to evaluate their performance accurately. If possible, consider using ensembles of methods to boost accuracy. Also, using what you or domain experts know about the field can guide your choice of method.
There is no one-size-fits-all solution; the best method will depend on specific characteristics of your data, the nature of the anomalies you aim to detect, and your particular requirements.
Evaluating an anomaly detection method can be particularly challenging in fields like fraud detection, where anomalies are infrequent yet significant.
Metrics such as precision, recall, and the F1-score are crucial for assessing the effectiveness of these methods in catching fraudulent activities while reducing false positives.
In contexts like predictive maintenance, the ROC curve and AUC metrics are invaluable for timely identification of potential machine failures.
In industries such as healthcare, visualizations are frequently used to monitor patient vitals, yet the accuracy of such methods heavily depends on domain expertise for correct interpretation.
Univariate vs Multivariate Data
Before starting your outliers analysis, it is important to take into account if your data is univariate or multivariate.
Univariate time-series data consists of a single sequence of observations recorded over time. Typical examples include daily stock prices, monthly sales figures, or yearly weather data.

In contrast, multivariate time-series data involves multiple variables or sequences that are observed and recorded at the same time intervals.
This type of data captures the relationships and interactions between different variables along with their individual trends and seasonal variations. For example, a multivariate time series could include daily measurements of temperature, humidity, and wind speed, all recorded simultaneously.
Some of the methods that are described in this article are more suitable for univariate data whether others are tailored to handle multiple variables.
However, some of them can be applied to both. Before diving into the methods, I will give you here an overview of several common methods for these two kinds of data:
For univariate data, visual inspection methods like time-series plots and box plots are commonly used, focusing on one variable at a time. STL decomposition is also traditionally used in univariate settings. Z-scores, Modified Z-score Methods and Grubbs' Test are also used for this kind of data.
Machine learning methods like Isolation Forest, LOF and Autoencoders are typically used in multivariate data for dimensionality reduction and anomaly detection, but they can also compress and reconstruct univariate time-series data to identify anomalies based on reconstruction errors.

PS: There are more outlier detection methods than the ones listed in this mind map.
For data with multiple variables, scatter plot analysis are common to examine the relationship between multiple variables. Isolation Forests, LOF, and Autoencoders are naturally suitable for handling high-dimensional data.
Note that several univariate methods can also be applied to multivariate data. For example, Z-scores methods can also be used in multivariate scenarios by calculating the Z-score for each variable independently.
Box plots can be used for each variable in a multivariate dataset separately to identify outliers in each dimension. In multivariate scenarios, scatter plots can be used to plot pairs of variables. STL decomposition, though traditionally univariate, can be adapted to analyze multivariate series by decomposing each series independently.
What are the Best Methods to Detect Outliers in your data?
Visual Methods
Visual inspection is a fundamental method for identifying outliers in time-series data. The nature of the data also influences how visual inspections should be conducted.
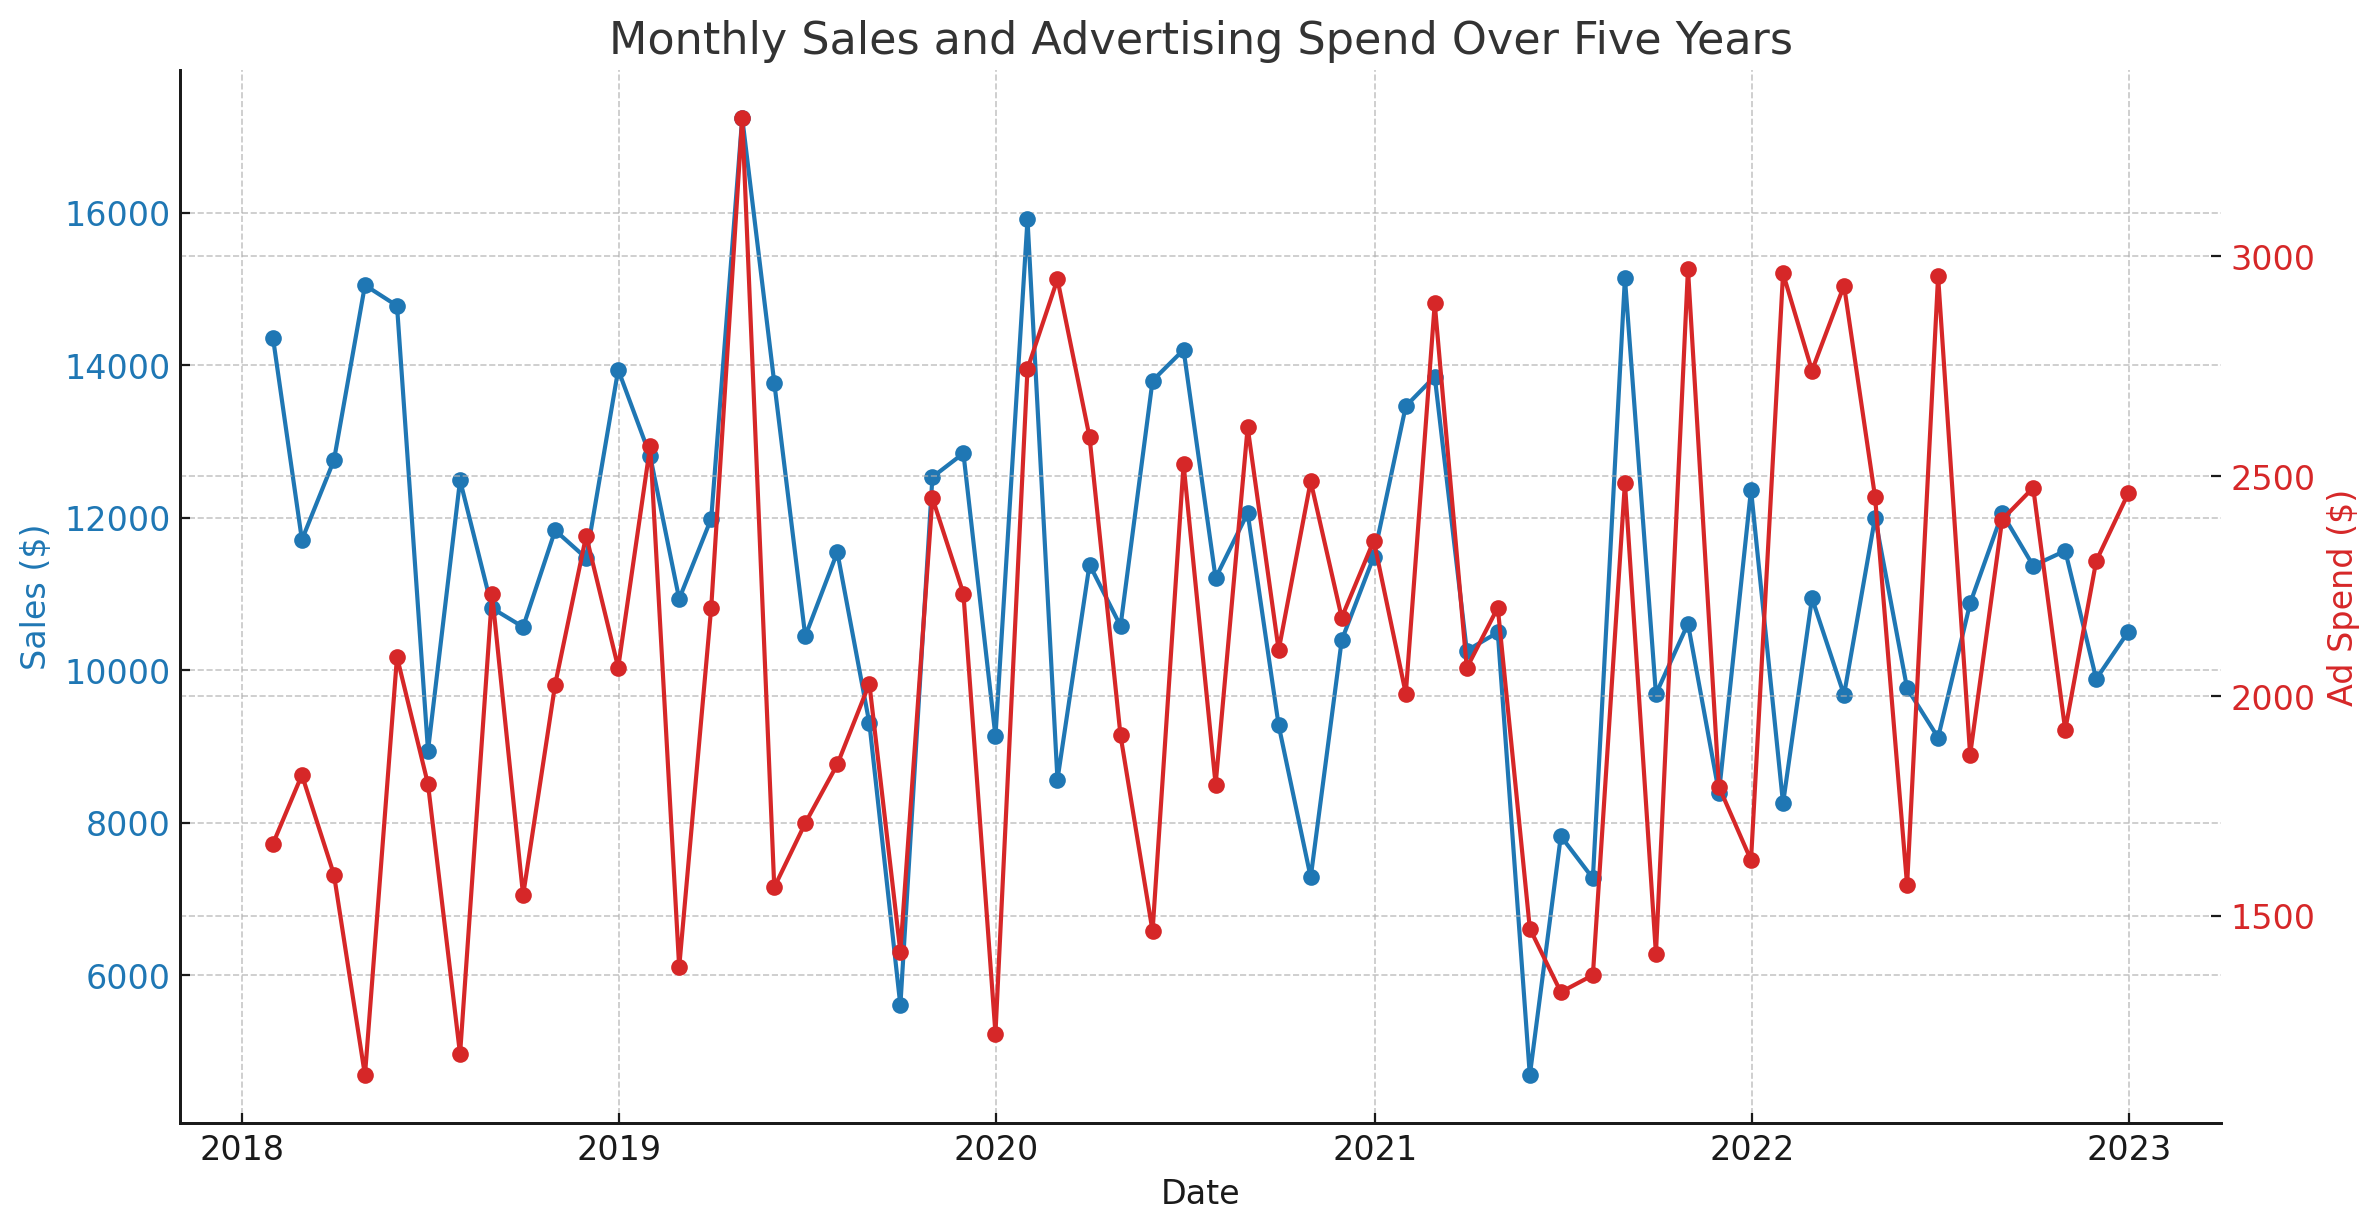
Time-Series Plot
This is the most straightforward plot for time-series data. It allows you to see trends, patterns, seasonal variations, and potential outliers over time. Points that deviate significantly from the rest of the data can often be easily spotted.
import matplotlib.pyplot as plt
import matplotlib.dates as mdates

def plot_temporal_trends(df, columns):

    num_plots = len(columns)
    fig, axes = plt.subplots(num_plots, 1, figsize=(10, num_plots * 3), sharex=False)  # sharex=False to not share x-axis
    fig.suptitle(f'Temporal Trends', fontsize=16, y=1.02 + 0.01 * num_plots)

    if num_plots == 1:  # Ensure axes is iterable
        axes = [axes]

    for ax, col in zip(axes, columns):
        ax.plot(df.index, df[col], marker='o', markersize=4, linestyle='-', label=col)
        ax.set_title(f'{col} - {title}')
        ax.set_ylabel('Value')

        # Setting the date formatter for each subplot's x-axis
        ax.xaxis.set_major_locator(mdates.YearLocator(base=2))
        ax.xaxis.set_major_formatter(mdates.DateFormatter('%Y'))

        # Rotate and align the tick labels so they look better
        ax.tick_params(axis='x', rotation=45)

        ax.legend()

    plt.tight_layout(rect=[0, 0, 1, 0.97])  # Adjust layout to make room for the title
    plt.show()

columns = df.columns.tolist()
plot_temporal_trends(df, columns)
Can you spot the outliers?
