Uncovering the secrets of KEEPFILTERS in DAX
The KEEPFILTERS() function in DAX is an underestimated function. So, I decided to go into the rabbit hole of this function and provide you with some interesting details about this function and one surprising effect.

Introduction
When we use the CALCULATE() function in Dax, we usually add a simple filter like this:
Product[Color] = "Green"
This filter replaces any existing filter on the column [Color] with the value "Green".
But sometimes, we need to go the extra step and preserve an existing filter on a table or a column to perform some interesting calculations.
And sometimes, we get the wrong result from our Measures, and we can't understand why this happens.
These are the situations where the KEEPFILTERS() function can help us.
Source Query
First, let's define the Query on which we want to work.
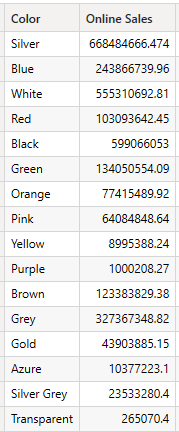
I want to get a List of Online Sales by Color:
DEFINE
  MEASURE 'All Measures'[Online Sales] = SUMX('Online Sales', [UnitPrice]*[SalesQuantity])

 EVALUATE
     SUMMARIZECOLUMNS('Product'[Color]
                      ,"Online Sales", [Online Sales]
                      )
I use SUMX to multiply [UnitPrice] by [SalesQuantity].
The result looks like this:
The query looks like this when I add a filter with CALCULATE(), as described above.
// Only Green Sales
DEFINE
  MEASURE 'All Measures'[Online Sales] = SUMX('Online Sales', [UnitPrice]*[SalesQuantity])

  MEASURE 'All Measures'[All Green Sales] =
                 CALCULATE([Online Sales]
                            ,'Product'[Color] = "Green"
                            )

EVALUATE
  SUMMARIZECOLUMNS('Product'[Color]
                    ,"Online Sales", [Online Sales]
                    ,"Green Sales", [All Green Sales]
                    )
And the result looks like this:

This happens because we replace the filter on the [Color] column with "Green". Consequently, the Measure returns the same value for the Sales with [Color] = "Green" on all rows.
Introducing KEEPFILTERS()
OK, what can we do with KEEPFILTER()?
When we add KEEPFILTERS() to our Measure, CALCULATE will retain the filter context on each row and will add the filter in the expression:
// Only Green Sales with KEEPFILTERS()
DEFINE
  MEASURE 'All Measures'[Online Sales] = SUMX('Online Sales', [UnitPrice]*[SalesQuantity])

  MEASURE 'All Measures'[All Green Sales] =
                CALCULATE([Online Sales]
                          ,KEEPFILTERS('Product'[Color] = "Green" )
                          )

EVALUATE
    SUMMARIZECOLUMNS('Product'[Color]
                    ,"Online Sales", [Online Sales]
                    ,"Green Sales", [All Green Sales]
                    )
This is the new result:

OK, great. And what's now?
Being Fancy
Now we can add some logic to our Measures. For example, we can perform calculations only in Sales for Green products.
For example, let's double the Sales for Green products:
// Perform some dynamic calculations - Double the Green Sales
DEFINE
  MEASURE 'All Measures'[Online Sales] = SUMX('Online Sales', [UnitPrice]*[SalesQuantity])

  MEASURE 'All Measures'[All Green Sales] =
              CALCULATE([Online Sales]
                        ,KEEPFILTERS('Product'[Color] = "Green" )
                        )

 EVALUATE
  SUMMARIZECOLUMNS('Product'[Color]
                    ,"Online Sales", [Online Sales]
                    ,"Green Sales", [All Green Sales]
                    ,"Dynamic Sales", IF(ISBLANK([All Green Sales])
                                        ,[Online Sales]
                                        ,[Online Sales] * 2
                                        )
                    )
I use IF() and ISBLANK() to check if the Sales are for Green products.
I return the [Online Sales] Measure result if the Measure for Green Sales is blank. If not, I double the result of the [Online Sales] Measure.
Look at the results:

But how can we use this mechanism in Power Bi?
For example, I want to be able to select a Color and perform a specific calculation for the Sales with this color.
First, I add a new table to the Data model, but I do not add any new Relationships to the Data model:
All Colors = SUMMARIZECOLUMNS('Product'[Color])The table looks like this:

Now, I add this column as a Slicer to my report.
Next, My Measure must get the selected color and add it as a Filter:
Modify by selected color =
VAR SelectedColor = SELECTEDVALUE('All Colors'[Color])

VAR CalcByColor = CALCULATE([Online Sales (By Order Date)]
                            ,KEEPFILTERS('Product'[Color] = SelectedColor)
                            )

RETURN
IF(ISBLANK(CalcByColor)
    ,[Online Sales (By Order Date)]
    ,[Online Sales (By Order Date)] * 2
    )
This way, I can perform my calculation based on the selected color in the new table:

This technique opens up many possibilities with our calculations, as we can perform calculations for one row without affecting the result of all other rows.
Work with Context Transition
But there are situations where it is vital to understand the value of KEEPFILTER(): Context transition.
You can learn more about Context transition by reading my article on this topic:
The situation is tricky when we use Context Transition in a Measure together with a so-called arbitrarily shaped set (More on this in a bit).
To show this, I change our example a little bit:
I want to create a Slicer to filter the Product table by all combinations of Brands and Colors.
Then I want to calculate the Average Sales for each Brand and color.
For this example, I don't use the columns from the Product table. I want a separate table for this example to simulate a real-world scenario.
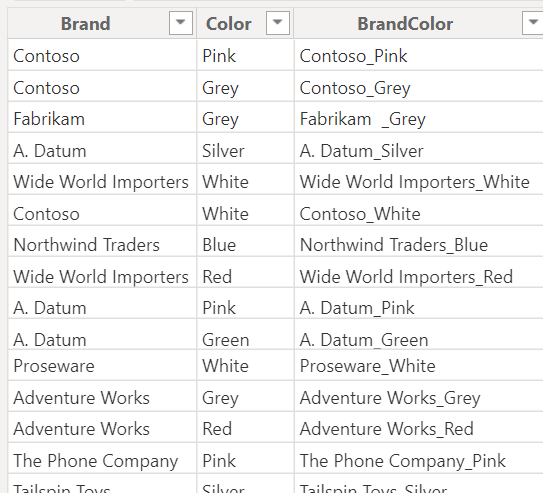
To achieve this, I use Power Query to extract a table from the original Product table to get a list of all Brands with all Colors. In Addition, I add a key column, consisting of the combination of the columns Brand and Color.
Here an extract from the resulting table:
I add the same key column to the product table.
Now I can add a Relationship between these two tables:

Now, I create the following Measure:
Average over Brand = AVERAGEX(VALUES('Brand Colors'[Brand])
                                ,[Online Sales (By Order Date)]
                                )
But when we try to validate the result, we will have a hard time.
The reason is that it's difficult to understand if the result is correct without any control result.
So either we recalculate the results in Excel, or wherever possible, or change the Measure to use SUMX().
This makes life easier as we will be able to compare the results with the existing Online Sales Measure.
Here is the result in Power BI:

If you carefully look at the result, something is wrong.
The Subtotals and the Total are much higher than the sum of the results per line.
The reason for this is how the filter is applied in this case.
For the table, we expect a filter like this:
(Brand = "A. Datum" AND Color IN ("Black", "Blue")
OR
(Brand = "Adventure Works" AND Color IN ("Grey", "Silver")
Such a set is called an "Arbitrarily shaped set", as we mix different values from two separate columns.
When we look at each Sub-total, we would expect two filters:
For Adventure Works, we expect the following:
Brand = "Adventure Works" AND Color IN ("Grey", "Silver")For A. Datum we expect:
Brand = "A. Datum" AND Color IN ("Black", "Blue")In fact, we get two completely different filters:
For the Subtotal for Adventure Works, we have the following filter:
Brand IN ("Adventure Works", "A. Datum") AND Color IN ("Grey", "Silver")For the Subtotal for A. Datum we have the following filter:
Brand IN ("Adventure Works", "A. Datum") AND Color IN ("Black", "Blue")This means that the Measure calculates the sum of all Sales for the selected colors but includes both selected brands in the result.
We can prove that something strange is going on when we add a new Matrix Visual and add the Brand and Color Columns from the Product tables and compare the Result with the Standard Online Sales Measure:

As you can see, the results are different between these two examples, which makes this effect extremely confusing.
The applied filter is now the following:
(Brand = "A. Datum" AND Color IN ("Black", "Blue", "Grey", "Silver"))
 OR
(Brand = "Adventure Works" AND Color IN ("Black", "Blue", "Grey", "Silver"))
The SQLBI articles mentioned in the References section below explain this effect in more detail.
To solve this issue, we can use KEEPFILTERS() to enforce the complete filter context from the Slicer:
Average over Brand = SUMX(KEEPFILTERS(
  VALUES('Brand Colors'[Brand]))
          ,[Online Sales (By Order Date)]
          )
Now the result is as expected:


Conclusion
The DAX functions KEEPFILTERS() can be very useful, sometimes a vital function.
It's not my intention to suggest always using KEEPFILTER() when you use Context transition.
But you need to be aware of the consequences of using context transition and of the possibility that you users create arbitrarily shaped sets when they use the Slicer on their reports.
At the time of this writing, I'm unaware of any drawbacks when adding KEEPFILTERS() using Context transition. But I'm a fan of keeping things simple and not adding any stuff if it's not necessary.
Anyway, the most important lesson of this article should be "trust only the result that you can prove and validate".
There are some functions out there that can be very challenging to validate. Two of them are AVERAGE and COUNTDISTINCT. These two can return results that are difficult to prove.
But this is a different story.
References
Introduction to KEEPFILTERS() by SQLBI: https://www.sqlbi.com/articles/using-keepfilters-in-dax-updated/
Read this article written by SQLBI with some interesting details: https://www.sqlbi.com/articles/keepfilters-a-new-dax-feature-to-correctly-compute-over-arbitrary-shaped-sets/
When we use Iterators, we use Context Transition. Here is another SQLBI Article about this topic: https://www.sqlbi.com/articles/when-to-use-keepfilters-over-iterators/
I use the Contoso sample dataset, like in my previous articles. You can download the ContosoRetailDW Dataset for free from Microsoft here.
The Contoso Data can be freely used under the MIT License, as described here.
You can support my work, which I do during my free time, through
https://buymeacoffee.com/salvatorecagliari
Or scan this QR Code:

Any support is greatly appreciated and helps me find more time to create more content for you.
Thank you a lot.
