2 Tasks to Boost Your Python Data Wrangling Skills
When learning a new tool, we usually go over the docs, watch tutorials, read articles, and solve examples. This is a good-enough approach and will help you learn the tool to a certain extent.
However, when we start using the tool in real-life settings or for solving real issues, we need to go a little beyond what's covered in most tutorials.
In this article, I'll explain step-by-step how I used Python for handling two different Data Cleaning and preprocessing tasks at my job. For each task, I'll show you the raw data and the desired format. Then, I'll explain the code for getting the data to that format.
We'll dive deep into Python's built-in data structures and Pandas library so you should expect to learn some interesting stuff on data wrangling with Python.
1. Issue stats
I have a DataFrame with a list of issues and their summaries. I'm not using or sharing the original data I have here. Instead, I generated mock data in the same format as with the original one. If you want to follow along by executing the code, download the "mock_issues.csv" file from my datasets repository.
What we'll do in terms of data wrangling depends on the format rather than the content so the functions and methods we'll learn in this article are applicable to the original data. In fact, the process is exactly the same as what I did at my job.
Consider we have a DataFrame of several rows with the following columns:

Each row in the raw issues column contains a list of issues in the following format:
Python">"""
"[1-The find_duplicates method is inefficiently using the data structures leading to high time complexity.,
2- Built-in data structures are not used efficiently in the generate_meta method.,
3- In the ExerciseGenerator class, excessive use of global variables may slow down the program.,
4- The get_all_contributors_for_repo method is not using built-in functions and libraries which are optimized for performance.,
..."
"""
It's quite a long string (between 30 and 50 issues in each row) but I just pasted a small part of it. One thing to note is that although it contains a list of issues, the entire list is stored as a single string.
The summaries column contains the summary of these issues in JSON format along with the issue ids that belong to each summary. Keys are the issue summaries and the values are a list of issue ids covered by that summary.
The issue ids are the numbers at the beginning of each issue (the first one is 1, the second one is 2, and so on). The format is JSON
The following is a part of the JSON in the first row:
{
  "issue_summaries": {
    "Inefficient use of data structures and built-in functions": [1, 2, 4],
    "Poor memory management": [5],
    "Inadequate testing practices": [6, 7, 8, 9, 10],
    "Poor code design principles": [12, 13, 14],
    "Excessive use of global variables": [3]
  }
}
The task is to calculate the following stats for issue summaries and store them in a DataFrame:
- Total number of issues
- Total number of summaries
- Average issue count per summary
- Standard deviation of average issue counts
The end result (for one row) will look like this:

There are many different approaches for handling this task. Mine is as follows:
- Convert the string in the summary column to a dictionary. It's in JSON format but stored as a string so we need to load it into a dictionary.
- Issue summaries are the keys of the dictionary. Iterate keys and extract the values, which are lists that store the issue ids.
- Find the length of these lists (i.e. number of items in the list) to get the number of issues per summary.
- Store these numbers in a list
- Find the sum, average, and standard deviation of the numbers in this list as well as the number of items in it
- Repeat the steps above for all the rows
The following code snippet performs steps 1–4 above for the first row:
import pandas as pd
import json

df = pd.read_csv("mock_issues.csv")

summaries = json.loads(df.loc[0, "summaries"]).get("issue_summaries")

issue_count_per_summary = []

for summary in summaries:
    issue_count_per_summary.append(len(summaries[summary]))

print(issue_count_per_summary)

# output
[3, 1, 5, 3, 1]
In the first line where we create the summaries variable, we take the JSON string in the first row of the summaries column and convert it to a dictionary using the loads function of the built-in json module. Then, we get the issue summaries using the get method.
Then, in the for loop, we iterate the keys of the summaries dictionary and get the values, which are the issue ids that correspond to each summary. The issue ids are stored in a list so the length of this list gives us the number of issues per summary.
The output list contains the number of issues per summary. The sum of these numbers will give us the total number of issues that are included in a summary. You may argue that we can easily get the total number of issues from the raw issues column but what we're interested in are the issues with a summary. Although very rare, some issues are not covered by any summary.
For step 5, we will calculate the sum, average, and standard deviation of the numbers in this list. To get the number of summaries, we'll find the length of this list.
Again, there are different ways of doing this task. What I'll do is to first convert this list into a Pandas Series and apply relevant functions to find the required metrics.
The following line of code will do this job:
pd.Series(issue_count_per_summary).apply(["sum","count","mean","std"]).values

# output
array([13. , 5. , 2.6 , 1.67332005])
The final step is to do the same for all the rows in our DataFrame. We can simply put the code in a for loop that iterates the rows of the DataFrame. To save the results, we'll create another DataFrame of the following columns:
- number of issues
- number of summaries
- average issue per summary
- standard deviation
Here is the code snippet that does all these operations:
# create an empty DataFrame to save the results
results = pd.DataFrame(
    columns=[
        "number_of_issues",
        "number_of_summaries",
        "avg_issue_per_summary",
        "std"
    ]
)

# iterate over the rows of the DataFrame that contains summaries
for i in range(len(df)):

    summaries = json.loads(df.loc[i, "summaries"]).get("issue_summaries")

    issue_count_per_summary = []

    for summary in summaries:
        issue_count_per_summary.append(len(summaries[summary]))

    # store the results
    results.loc[i, :] = pd.Series(issue_count_per_summary).apply(["sum","count","mean","std"]).values
The results DataFrame looks like the following, which is the end result we expect:
The resulting DataFrame has one row because the mock dataset contains one row of issues and summaries. The for loop above will work no matter how many rows the DataFrame contains as long as the formatting is consistent.
2. Issue summary matching
In the raw dataset, we have a list of raw issues and summaries, which correspond to one of more issues.
The second task is to create a DataFrame that has a row for each issue with the following columns:
- issue id
- raw issue
- issue summary
The initial form of the data:
What we want to achieve:

This tasks consists of several parts, which are:
- Extract issue ids and issues separately from the following list
- Normalize the issue summaries
- Merge issues and summaries
Extract issue ids and issues separately from the following list
"""
"[1-The find_duplicates method is inefficiently using the data structures leading to high time complexity.,
2- Built-in data structures are not used efficiently in the generate_meta method.,
3- In the ExerciseGenerator class, excessive use of global variables may slow down the program.,
4- The get_all_contributors_for_repo method is not using built-in functions and libraries which are optimized for performance.,
..."
"""
Although it looks like a list, it's a single string. The issues are ordered (from 1 to 12) and separated by comma inside the string.
We can split the string at commas but some issues include a comma (e.g. the first one after the word however) so splitting at commas will not work.
I tried splitting at the "-" character since the issues are written as "1-", "2-", and so on. However, this splitting resulted in more than 50 issues so there must be some issues that contain "-".
A proper solution would be to split at the occurrences of numbers between 1 and 12. To do this, we need to use the split method available under the built-in re module and use a regular expression that represents numbers between 1 and 12 (I used a regex to represent numbers from 1 to 50 because the original data has 30–50 issues in a row).
Here is how we do this:
import re

raw_issues = re.split(
    r'b([1-9]|[1-4][0-9]|50)b' + r'-', df.loc[0, "raw_issues"]
)[2::2]

print(len(raw_issues))

# output
12
So we have a list of 12 issues. Let's delve into the code to better understand how it completes the task.
"b([1–9]|[1–4][0–9]|50)b" is the regular expression (i.e. regex) for numbers between 1 and 50 so the split method splits the string when it detects a number between 1 and 50. df.loc[0, "raw_issues"] contains the raw issues in the first column, which is the string we want to split.
The result of this splitting looks as below:
"""
['"[',
 '1',
 'The find_duplicates method is inefficiently using the data structures leading to high time complexity., n',
 '2',
 ' Built-in data structures are not used efficiently in the generate_meta method.,n',
 '3',
 ' In the ExerciseGenerator class, excessive use of global variables may slow down the program.,n',
 '4',
...
"""
Starting from the second item, it goes like "number, issues, number, issue, …". Hence, to get only the issues, we need to select every other item starting from the second one, which can be done using [2::2] indexing.
Its syntax is "starting index : ending index : step size". The ending index can be left blank if we want to until the very end of the list.
We now have a raw issues list that contains 12 issues starting from id 1 and going up to id 12.
Normalize the issue summaries
Issue summaries are stored in JSON format where keys are the issue summaries and the values are a list of issue ids covered by that summary.
Here is a small part of the issue summaries JSON in the first row:
json.loads(df.loc[0, "summaries"]).get("issue_summaries")

# output
{'Inefficient use of data structures and built-in functions': [1, 2, 4],
 'Poor memory management': [5],
 'Inadequate testing practices': [6, 7, 8, 9, 10],
 'Poor code design principles': [12, 13, 14],
 'Excessive use of global variables': [3]}
The output of the json.loads is a Python dictionary.
We need them in the following format:

There are different ways of getting the desired format. We'll use the json_normalize , transpose , and explode functions for this task.
json_normalize normalizes the JSON format by creating a DataFrame where keys are the columns and values are the row values.
Let's see the output of this step:
pd.json_normalize(json.loads(df.loc[0, "summaries"]).get("issue_summaries"))
transpose simply transposes it to a format where the columns become the index of the DataFrame.
pd.json_normalize(
    json.loads(df.loc[0, "summaries"]).get("issue_summaries")
).transpose()
We want the issue summaries as a column instead of index so we'll reset the index. Then, we'll rename the columns properly. Let's also save the results into a DataFrame called summaries.
summaries = pd.json_normalize(
    json.loads(df.loc[0, "summaries"]).get("issue_summaries")
).transpose().reset_index().rename(
    columns={"index": "summaries", 0: "issue_ids"}
)

summaries.head()In the DataFrame above, each row contains a summary and the issue ids associated with it. We need to take this one step further and create a line for each summary-issue pair. So, the first line will be converted into two lines with the same summary but a different issue id (1 and 10).
Thankfully, the explode function makes this step quite easy.
summaries = summaries.explode(column="issue_ids").reset_index(drop=True)

summaries.head()Merge issues and summaries
The final step is to combine raw issues and the summaries we created in steps 1 and 2. We can merge them on the issue ids.
Here is how we do this:
# create a DataFrame of raw issues
final_df = pd.DataFrame({
    "issue_ids": range(1,51), # create a column of ids from 1 to 50
    "raw_issues": raw_issues
})

# merge summaries
final_df = final_df.merge(summaries, on="issue_ids", how="left")

final_df.head()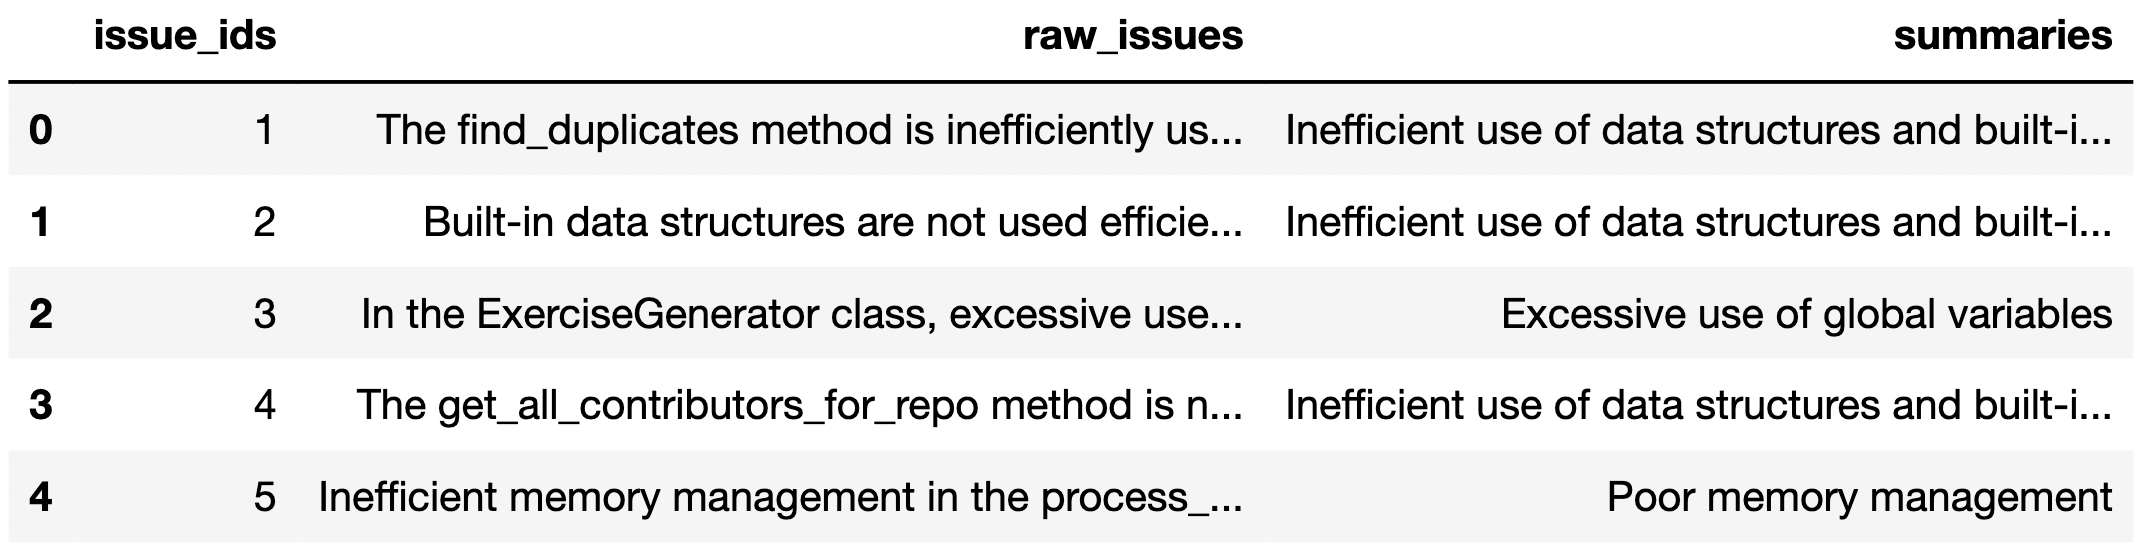
We have a DataFrame that has a row for each issue and also contains the corresponding summary.
We actually need to do all these for each row of the initial DataFrame, which can easily be done by putting the code we wrote in a for loop that iterates the rows of the initial DataFrame.
Final words
Raw data can be quite messy. Converting it into a more usable and structured format is an essential part of data pipelines. Thankfully, we have many great tools that simplify and expedite this process.
In this article, we learned how to leverage Python and Pandas for preprocessing a raw dataset. We did it in a highly efficient way of learning a new tool, which is solving a real-life task.
Thank you for reading. Please let me know if you have any feedback.
