Customer Segmentation: More Than Clustering

When the need arises for a data science team to build a customer segmentation model, it's either an ask from the business or, more rarely, a pro-active decision from data scientists. In both cases, the need is the same: a deeper understanding of the customer base to make more refined, differentiated decisions on each segments.
However, I have seen many Clustering efforts not be adopted by the business because the resulting segments did not resonate or were not actionable by the business stakeholders. In this article, I'll outline keys steps and strategies to maximize the adoption of your segmentation within the business.
- Statement of work
- Tidy your data
- Nail your algorithm
- Understand your clusters
- How many clusters?
- Check for stability
- Translate to business rules (or not)
Given the focus on "Applied data science" rather than "Technical Machine Learning," this article refrains from delving into the intricate details of various clustering algorithms, as there are abundant resources available for those seeking a deeper understanding (here or here ).
Without further ado, let's get started!

1 – Statement of work: Objective, Dimensions, Timing
As with every piece of work, you need to answer a few important questions before diving into the technical work.
What are the business objectives of the segmentation?
→ Define what we are trying to understand about our customers.
There are many different ways to look at customers, for example, we could look at finding out what the main transactional behaviors are (e.g. in Retail: are they seasonal, what is their breath of products, value and frequency of transactions…) , or we could look at what types of products they buy (e.g. in Food: are they buying Convenience products or fresh, big packs for families, premium and organic products…), or we could look at how engaged customers are (e.g. in Banking: Have many essential services, how much assets they have and how active with the bank).
It's important for a segmentation not to try to answer everything at once. Rather than have one all-encompassing segmentation, it's often easier to build (and to convey to the business) several segmentations that look at customers in different ways – and then combine them if and when needed.
What are the dimensions of interest?
→ Define what concepts you want to center your segmentation on
Once you know what sort of question you want to answer with your segmentation, you need to isolate the dimensions your segmentation is going to be based on. As a data scientist with business acumen, you should already have a good idea – but it's important for this step to engage your stakeholders and leverage their expertise . This ensures that the segmentation will reflects the needs and perspectives of different teams, but also that you have stakeholder buy-in throughout the development process.
In this context, I'm referring to "dimensions", not specific variables or data elements. The dimensions I mention embody abstract concepts such as "activity," "loyalty," "risk," and "value". It is crucial to formalize these dimensions – they will be the language your business stakeholders will understand. It's then up to you to find the data elements that would represent these dimensions, for example:
- Activity → Number of transactions in the last month
- Loyalty → Number of years with the bank
- Risk → Latest credit score
- Value → Total spend in last 12 months
What is the timing you want to use?
→What is the time period that the data will be pulled on to represent your customer?
Will it be a month? A week? A year? This depends on the nature, frequency of the data and if it presents seasonality. For example, a supermarket can probably gather enough meaningful customer information with 2 or 3 months of purchasing data. An online clothing retailer, on the other end, faces strong yearly seasonality (Black Friday + Holiday gifting), and would need to consider periods of 12 months increments.
→ How often will you re-score customers (assign segments)?
For a segmentation to remain actionable, it's crucial that the segment assigned to a specific customer accurately mirrors recent changes in their behavior or profile. The frequency of recalculating these segments depends on how rapidly the associated dimensions can change. For a supermarket where customer shop several times a week, re-calculating the segments weekly might make sense – especially if it coincide with weekly marketing efforts and decisions. For an online retailer where most customers shop a couple times a year, a monthly cadence of segment refresh could be more fitting.
→ How often will you re-train your model?
The goal for your segmentation model is to capture profiles of customers that are established and stable over-time, so there's typically no need for frequent model refreshes. Unless there are discernible and recent shifts in behaviors or the availability of a critical data point that could enhance the model, your segmentation model can effectively be used for an extended period, possibly spanning a couple of years.

2 – Tidy your data
You're likely aware of the importance of data preparation for a clustering project, with numerous resources available, including [here](https://www.analyticsvidhya.com/blog/2020/07/types-of-feature-transformation-and-scaling/) and here. Below are two beneficial transformations to undertake before applying normalization:
Jitter

This transformation is most helpful for integer data points with a small scale. For instance, consider variables like "Number of banking services" that usually ranges from 1 to a dozen. Implementing this transformation will enhance the visualization of your clusters.
You jitter by adding ]-.5,.5[ of random noise to the original value:
df=df.assign(Jittered_Services=df['Services']
        +np.random.normal(scale=0.49, size=len(df)))
Log transform
Data representing financial values often present skewed distributions, where a small number of individuals own a significant quantity of assets or debts . Skewed data has the potential to adversely affect the performance of machine learning models. Therefore, applying a log transformation proves beneficial in mitigating the impact of skewness and improving the model's robustness:
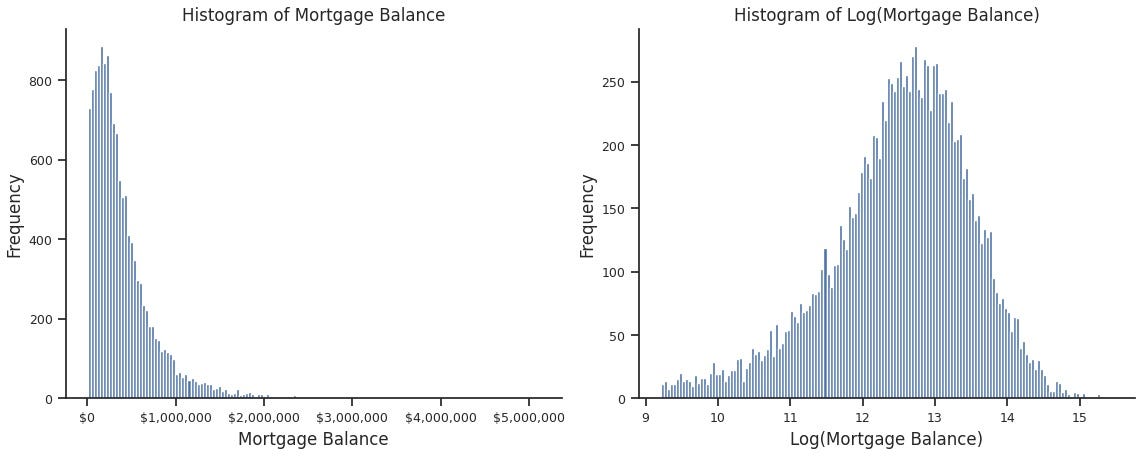
import numpy as np

df= df.assign(Log_Mortgage_Balance=np.log(df['Mortgage_Balance']))
This transformation – like jittering – significantly enhanced plots readability, especially once you become familiar with interpreting the log scale.
3 – Nail your algorithm
This article isn't a deep dive into the various clustering algorithms as there's a lot of good resources out there, in particular Scikit Learn.

To proceed to the next step, let's assume you've ran your best clustering algorithm with the optimal parameters and now all your customers are labeled with a specific cluster number.

4 – Understand your clusters
Unfortunately, clustering algorithms do not speak business language (at least not yet – I'm looking at you LLMs).
The algorithm essentially enables the data to convey the message: "Customers in cluster X share more commonalities among themselves than with customers in other clusters." The onus is on you to delve into the details and decipher the specific behaviors or profiles that define cluster X.
This cluster profiling is achievable either by using descriptive methods, or predictive methods.
Profiling clusters – the descriptive way
I found that using the two simple tools below in tandem proves effective for gaining a business understanding of clusters.
Summary stats with conditional formatting Utilizing summary statistics with conditional formatting involves presenting clusters' summary stats side by side and accentuating highs and lows through formatting. This approach allows emerging characteristics to become apparent. In the example below, I've employed the median, but you can choose your preferred summary statistic:

In the example above, it's evident that cluster "turquoise" and "red" share similar profiles, showcasing the lowest Var2, Var5, Var 6 and Var7. The distinguishing factors between them lie in Var4 and Var8. Additionally, cluster "dark blue" stands out with the highest value for Var2, whereas the key variable setting apart cluster "black" is Var3, where it exhibits the lowest value.
Scatter plots for all combinations of input variables Generating scatter plots for all combinations of input variables provides a visual representation that helps highlight the dimensions distinguishing various clusters. This approach allows for a clear identification of which dimensions separate specific clusters.

The scatter plots reveal that Var8 serves as the factor dividing cluster "red" and "green" from the other clusters (bottom right plot). Simultaneously, the confirmation of a low Var3 as the discriminator for cluster "black" is evident in the bottom-left plot.
This process is iterative: navigating between summary statistics and scatter plots, you can refine your understanding of the clusters and extract the insights needed to gain a deep understanding of their characteristics.
Name your clusters early
As you progress through this profiling process – consider assigning descriptive names to your clusters. This will force you to find the differentiating characteristics of each clusters at this stage and will help with stakeholder buy-in later on. At a later stage in the process (after steps 5 and 6), you can even engage stakeholders in an enjoyable exercise to name the clusters. Not only it will make for names that resonate with the business, but also help with stakeholder buy-in into the segmentations.
Successfully finding names that resonate effectively is what elevates your clusters from mere groupings to meaningful business segments.
Profiling clusters – the predictive way
Another method of profiling your clusters is to leverage a multi-class predictive model. If you consider the cluster number as the categorical variable to predict, you can use the variables as features and fit a model. Looking at the feature importance will then inform you on what variable are influencing each cluster.
If you fit a rather simple decision tree, inspecting the branches and the tree will tell you exactly what variables and cut-off values are used. Here is a good example.
In practice, I have yet to employ the predictive method as I was able to get a good understanding of cluster profiles using the descriptive methods. Furthermore, leveraging summary statistics proves indispensable in conveying clusters distinctions to stakeholders, making them an essential component of the approach.
5 – How Many Clusters?
We're all familiar with the elbow and the silhouette methods. But what if this methods suggest 2 clusters? Or 18? Would these configurations be useful or actionable for the business? With very few clusters (3 or fewer), the segmentation may not provide the in-depth understanding of customers that we aim for initially. On the other hand, a large number of clusters (9 or more) could render the segmentation challenging to evangelize, explain, and operationalize.
What I find informative is to begin with the above methods and actually execute the algorithms and profiling with different number of clusters. If the elbow method gives you 6 clusters (and you've profiled them so you understand them), what would 5 clusters look like? 7 clusters? 8 clusters? What are the clusters that are getting merged or split (indicative of closer behaviors) and what are the clusters that do not change (indicator of more distinct behaviors)?
This iterative exploration helps fine-tune the clustering solution and provides a nuanced understanding of the underlying patterns in the data.
In the illustrative example below, transitioning from 4 to 5 clusters doesn't impact clusters black and blue, but it reveals a new cluster, yellow, sits "in between" red and green. The question arises: does it make sense from a business perspective to split these customers into three groups instead of two?

This decision depends on the specific business goals and the interpretability of the clusters. Evaluating the significance of the behavior differences within the yellow cluster and assessing whether the granularity adds actionable insights are key considerations.
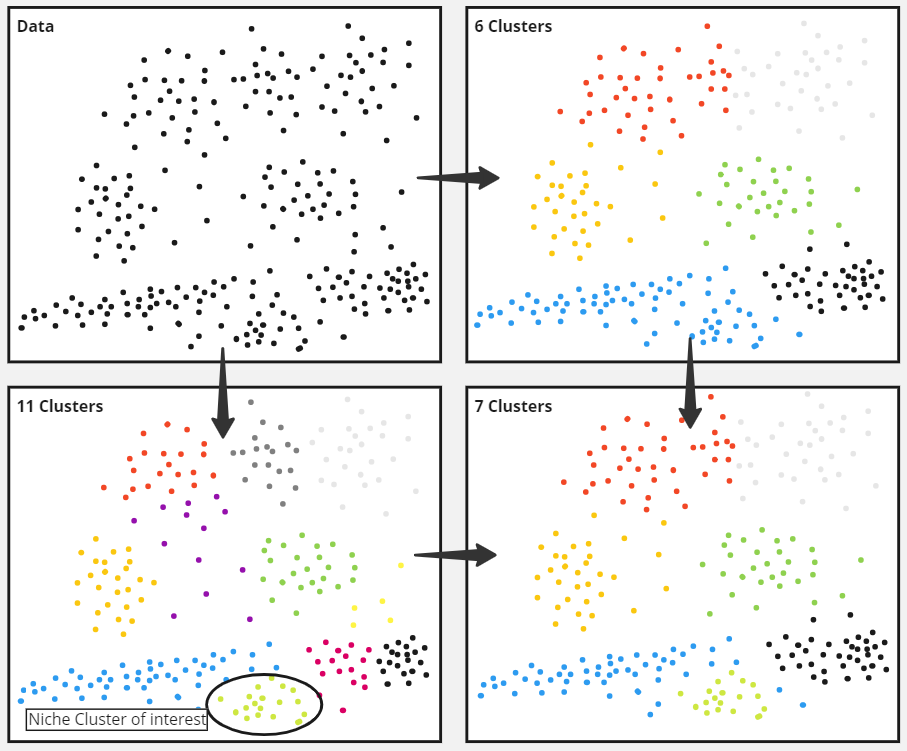
Running the algorithm with a higher number of clusters, say 12 or 15, allows you to explore whether distinct, niche behaviors emerge that potential make business sense.
Identifying these small but potentially important clusters that only manifest when using a higher number of clusters can be valuable. In such cases, you have the option to assign these customers to specific segments based on business rules derived from profiling the segments (see Section 7 below).
In the illustrative example below, a business-critical profile of customer is not getting surfaced by clustering until the data is split in 11 segments (light green cluster in the bottom-left panel). As the rest of the 11 segments are too granular, the final segmentation can be a mix of a 6-cluster segmentation with the addition of this very important, niche customer segment:
Be flexible with your clusters
Clustering is an important tool – but it remains a tool, not necessarily something to be taken at face value.
Injecting business knowledge into your clusters is a valuable step to ensure they align closely with industry nuances or the specific use case. If you find yourself content with your clusters overall but identify two that essentially convey the same meaning for the business, consider merging them into one. For instance, you might observe two distinct clusters with an inactive profile – one with no transactions and the other with very few transactions. From a business perspective, these may warrant the same action, justifying their merger. This manual intervention refines the clustering results, enhancing their relevance and applicability to real-world business scenarios.
In certain instances, the attribute defining a cluster may be conceptually appropriate, but the precise definition may not align with the established criteria. Take, for instance, the "risk" dimension measured by credit score in a banking segmentation. While it may result in a "higher risk" cluster, the criteria for a customer to be part of this group might not precisely match the rigid business definition of a risky customer, such as "credit score <640". In such cases, it could be beneficial to consider merging or splitting the cluster to better conform to the defined business rules.

6 – Check for stability
Imagine you land a great segmentation that deepens your organization understanding of its customers, and it is used to target and personalize marketing efforts. However, after just a few months, certain segments experience a substantial increase in size, while others diminish to almost negligible proportions, rendering the segmentation ineffective. The segmentation is not stable over time!
If there's seasonality in your data, ensure that you've implemented your segmentation on datasets spanning before, during, and after the seasonal events. For a comprehensive assessment, consider applying the segmentation to a full year or even two years' worth of data.
Below are two methods to assess segmentation stability:
Segment stability
At a high level, examining the size of each segment and its changes over time is valuable
- Are the segments sizes changing across the time periods?
- Are you comfortable with the changes in sizes you observe?
While some fluctuations may be justifiable and context-specific (for example in a supermarket context, maybe a "traditional cooking" segment is bigger than usual over Thanksgiving and the Holidays), drastic or prolonged shifts in segment sizes may necessitate a reevaluation of your approach. In such cases, revisiting the timeframe of your input data and expanding it might be necessary to ensure the stability and reliability of your segmentation.
Customer Migration
Examining customer migration at the individual level provides a more detailed perspective:
- How many times each individual customer changes segments over a specific period, such as a year?
- What are the specific segments that see the most movements?
While a limited number of migrations between segments reflecting closer behaviors may be acceptable, a high degree of movement could signal instability. In such cases, expanding the time window for customer data collection might be necessary to capture more stable profiles.
7 – Translate to business rules (or not)
In a business context where stakeholders may prefer transparency over a black-box model, a viable approach is to translate clusters or segments into explicit business rules.
Once you know the profiles of your segments, you can delineate lines within your dimensional space that best approximate these segments. These lines effectively become the business rules that define and characterize each segment. This translation to business rules not only enhances interpretability but also empowers stakeholders with a clear and understandable framework for segment identification and analysis.

In the provided example above, business rules could be articulated as follows: Turquoise Cluster: Var8 < 0.032 and Var5 < 2.4 Red Cluster: Var8 ≥ 0.032 and Var5 < 3

Final Step- Evangelize your segmentation
If you've reached this stage, you've successfully identified segments that exhibit distinct profiles and behaviors, and you've done this in alignment with the business's parameters. The coherence of segment profiles and their relevance to the business is evident, and you have confirmed the stability of these segments over time.
You've also most likely helped your direct business stakeholder to tailor the actions they need to take to each segment.
Now, are there additional applications for your segmentation that could bring business value?
- Dashboards – Are there some metrics and KPIs that would benefit from being looked at from the segmentation lens?
- Reports – Are there monthly or quarterly business reports and analyses where the segmentation could bring more profound insights into the customer base?
- Ad-hoc analysis – Is there any analysis being done where using the segmentation would uncover more granular results or recommendations?
Are there different channels where your segments could be used to personalize an action?
- Email or push notifications campaigns
- Phone call campaigns
- Home page landing experience
- Paid Search and Paid Media channels
Conclusion
I hope it is now clear that effective Customer Segmentation goes beyond the technical aspects of clustering algorithms. The success of a segmentation model can be summarized in the following aspects:
- Alignment with the business's objectives,
- Clarity of defined dimensions
- Thoughtful consideration of timing
- Flexibility in adapting clusters to business goals
- Stability over time
Ultimately, successful Segmentation creates a comprehensive and impactful framework for understanding and engaging with diverse customer profiles.
I'd love to hear if you find this framework useful. What else do you find crucial while embarking on a customer segmentation project? What did I miss? What do you do differently?
References:
[1] R. Yehoshua, Introduction to Clustering (2023), https://medium.com/ai-made-simple/introduction-to-clustering-2ffc22673b5a
[2] T.K. Aslanyan, A Comprehensive Guide to Clustering in Python (2023), https://medium.com/lunartechai/a-comprehensive-guide-to-clustering-in-python-f9fb36a94a05
[3] DisplayR, Data Preparation for Cluster-Based Segmentation (2017), https://docs.displayr.com/wiki/Data_Preparation_for_Cluster-Based_Segmentation
[4] P. Huilgol, Feature Transformation and Scaling Techniques to Boost Your Model Performance (2020), https://www.analyticsvidhya.com/blog/2020/07/types-of-feature-transformation-and-scaling/
[5] Scikit Learn, Overview of clustering methods (2023), https://scikit-learn.org/stable/modules/clustering.html
[6] I. Cohen, Explainable AI (XAI) with SHAP -Multi-Class Classification Problem (2021), https://towardsdatascience.com/explainable-ai-xai-with-shap-multi-class-classification-problem-64dd30f97cea
[7] E. Zuccarelli, Interpretable Clustering (2020), https://towardsdatascience.com/interpretable-clustering-39b120f95a45
[8] R. Khandelwal, K-Means Clustering: Techniques to Find the Optimal Clusters (2021), https://pub.towardsai.net/k-means-clustering-techniques-to-find-the-optimal-clusters-7eea5431a4fb
My other applied data science articles:
Decoding the Data Scientist Hierarchy: From Junior to Senior – What Sets Them Apart?
Elevate Your Data Science Career: How to become a Senior Data Scientist
5 Ideas to Foster Data Scientists/Analysts Engagement Without Suffocating in Meetings
