Scaling Numerical Data, Explained: A Visual Guide with Code Examples for Beginners
DATA PREPROCESSING

⛳️ More [DATA PREPROCESSING](https://medium.com/@samybaladram/list/data-preprocessing-17a2c49b44e4), explained: · [Missing Value Imputation](https://towardsdatascience.com/missing-value-imputation-explained-a-visual-guide-with-code-examples-for-beginners-93e0726284eb) · [Categorical Encoding](https://towardsdatascience.com/encoding-categorical-data-explained-a-visual-guide-with-code-example-for-beginners-b169ac4193ae) ▶ [Data Scaling](https://towardsdatascience.com/scaling-numerical-data-explained-a-visual-guide-with-code-examples-for-beginners-11676cdb45cb) · [Discretization](https://towardsdatascience.com/discretization-explained-a-visual-guide-with-code-examples-for-beginners-f056af9102fa?gi=c1bf25229f86) · [Oversampling & Undersampling](https://towardsdatascience.com/oversampling-and-undersampling-explained-a-visual-guide-with-mini-2d-dataset-1155577d3091) · [Data Leakage in Preprocessing](https://towardsdatascience.com/data-leakage-in-preprocessing-explained-a-visual-guide-with-code-examples-33cbf07507b7)
Numerical features in raw datasets are like adults in a world built for grown-ups. Some tower like skyscrapers (think billion-dollar revenues), while others are barely visible (like 0.001 probabilities). But our machine learning models? They're children, struggling to make sense of this adult world.
Data scaling (including what some call "normalization) is the process of transforming these adult-sized numbers into child-friendly proportions. It's about creating a level playing field where every feature, big or small, can be understood and valued appropriately.
We're gonna see five distinct scaling techniques, all demonstrated on one little dataset (complete with some visuals, of course). From the gentle touch of normalization to the mathematical acrobatics of Box-Cox transformation, you'll see why picking the right scaling method can be the secret sauce in your machine learning recipe.

Understanding Which Data Needs Transformation
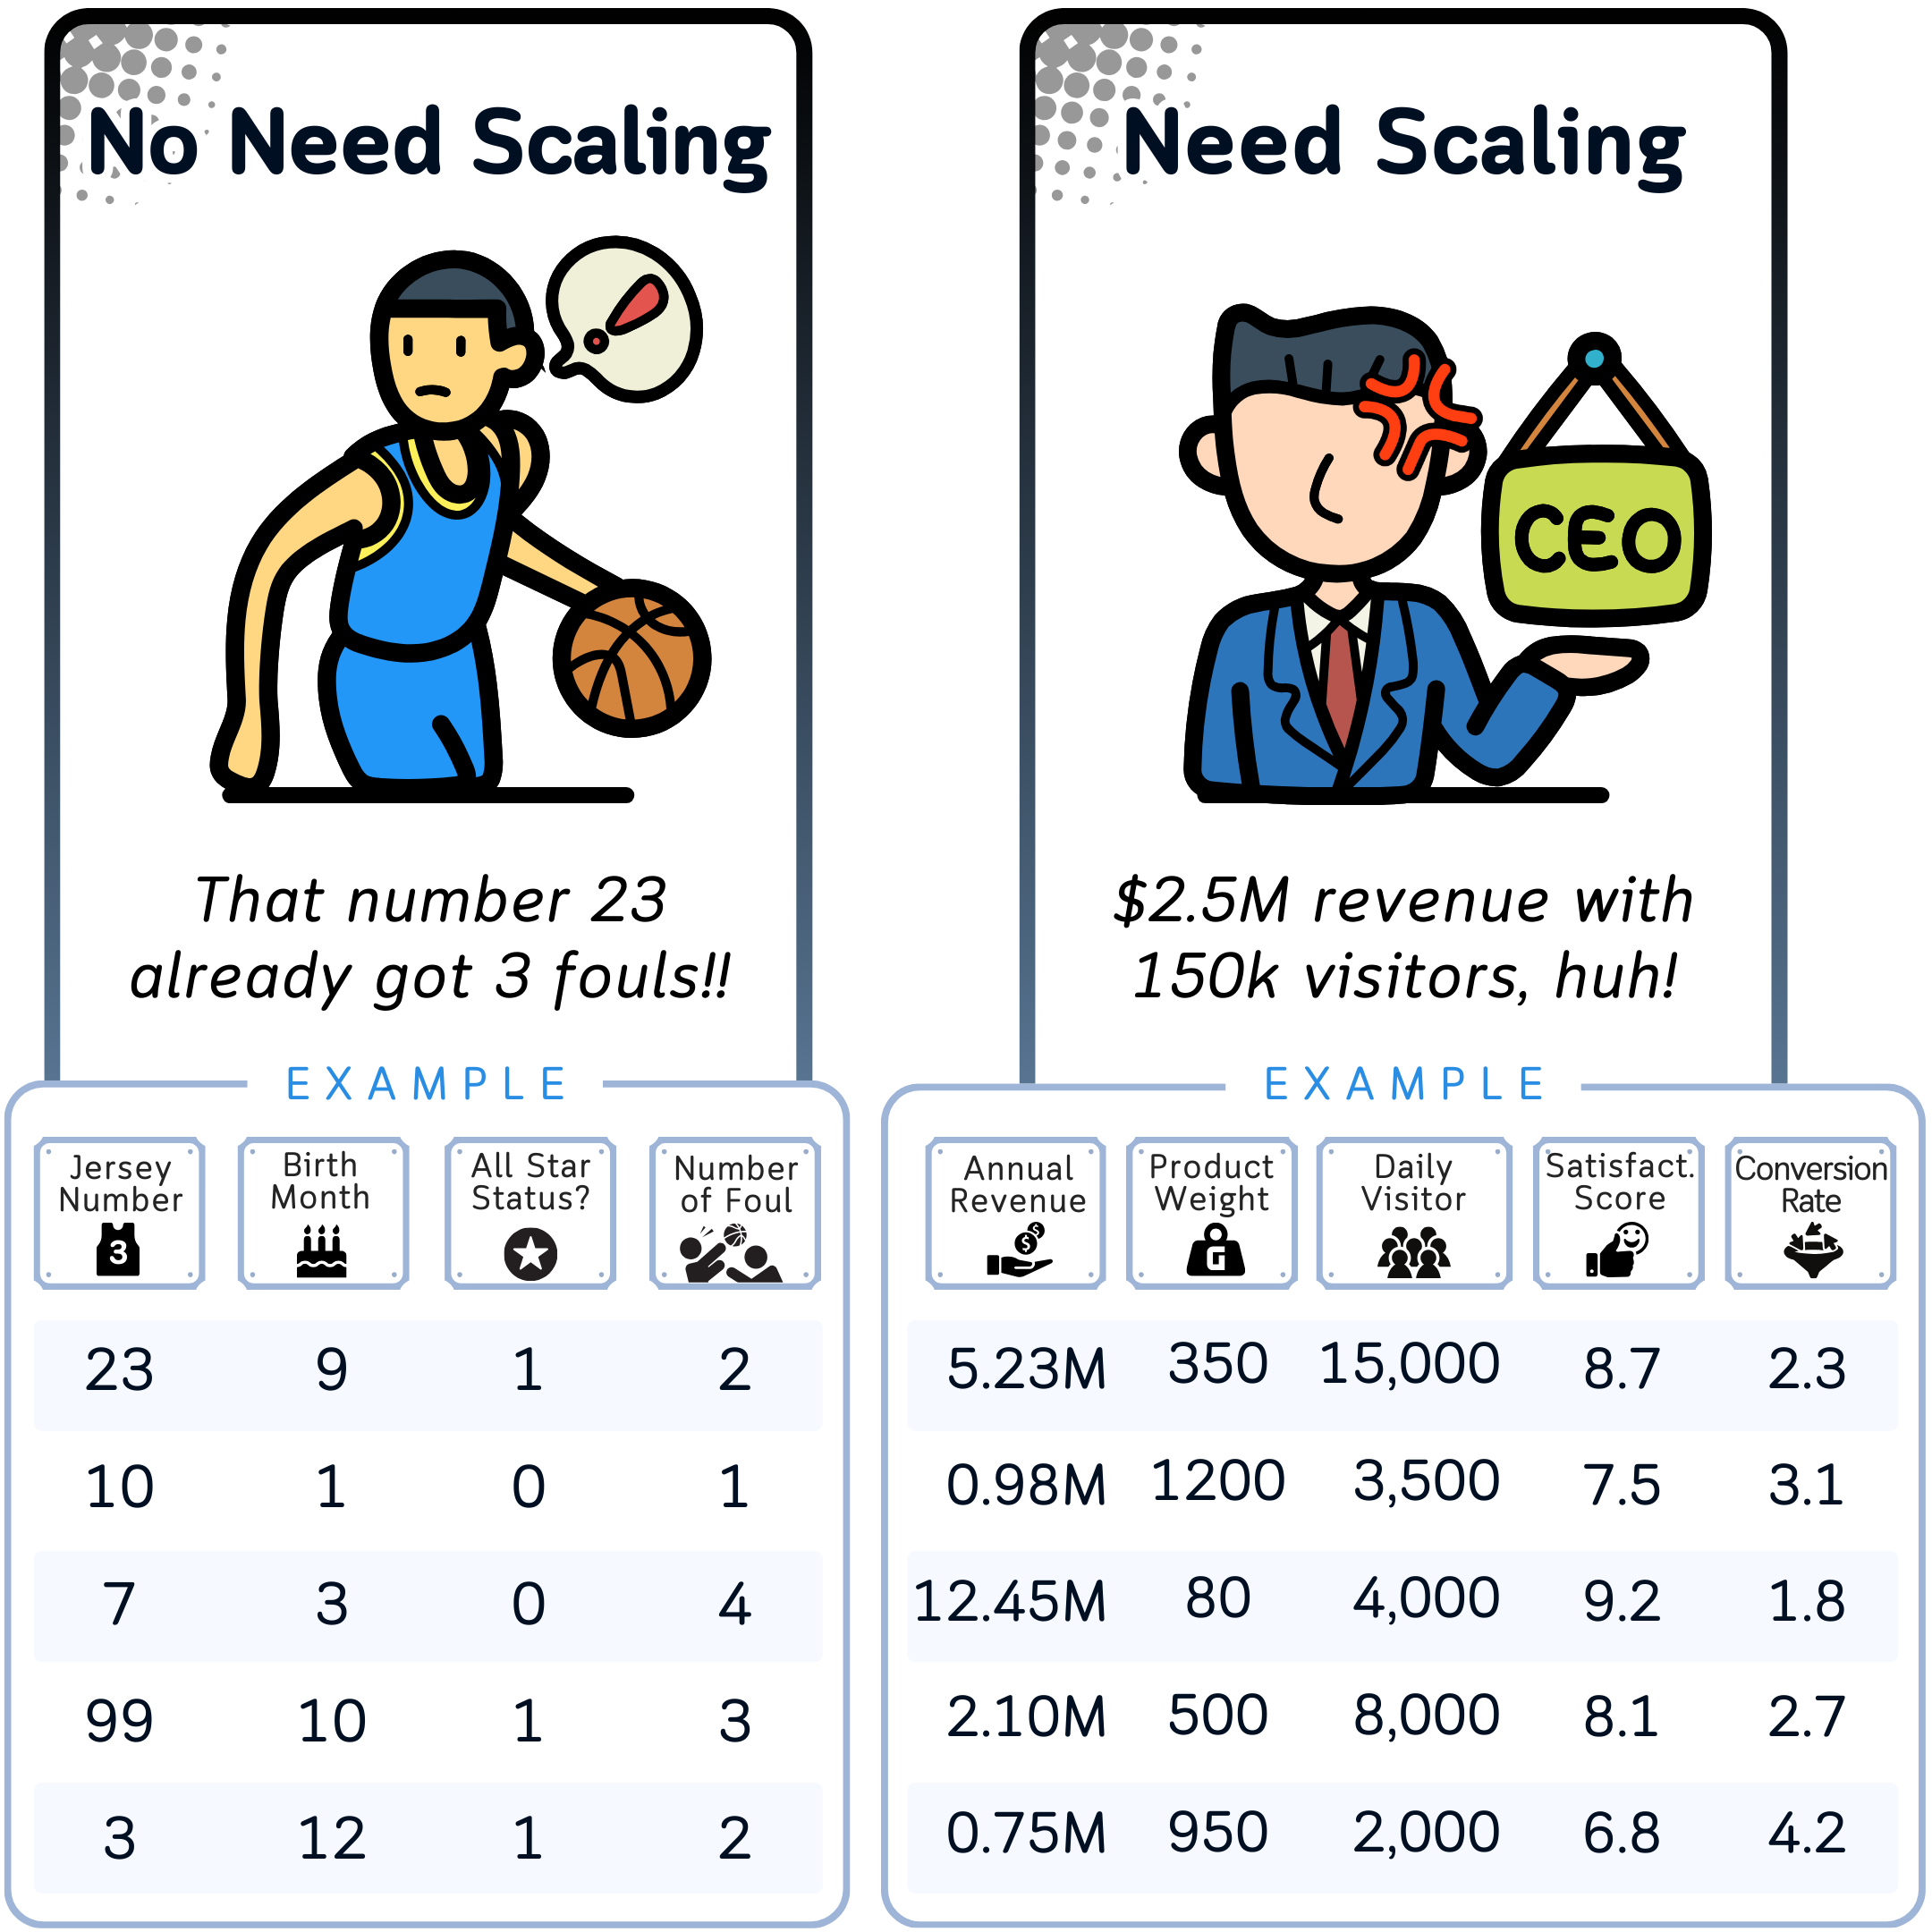
Before we get into the specifics of scaling techniques, it's good to understand which types of data benefit from scaling and which don't:
Data That Usually Doesn't Need Scaling:
- Categorical variables: These should typically be encoded rather than scaled. This includes both nominal and ordinal categorical data.
- Binary variables: Features that can only take two values (0 and 1, or True and False) generally don't need scaling.
- Count data: Integer counts often make sense as they are and scaling may make them harder to understand. Treat them as categorical instead. There are some exceptions, especially with very wide ranges of counts.
- Cyclical features: Data with a cyclical nature (like days of the week or months of the year) often benefit more from cyclical encoding rather than standard scaling techniques.
Data That Usually Needs Scaling:
- Continuous numerical features with wide ranges: Features that can take on a wide range of values often benefit from scaling to prevent them from dominating other features in the model.
- Features measured in different units: When your dataset includes features measured in different units (e.g., meters, kilograms, years), scaling helps to put them on a comparable scale.
- Features with significantly different magnitudes: If some features have values in thousands while others are between 0 and 1, scaling can help balance their influence on the model.
- Percentage or ratio features: While these are already on a fixed scale (typically 0–100 or 0–1), scaling might still be beneficial, especially when used alongside features with much larger ranges.
- Bounded continuous features: Features with a known minimum and maximum often benefit from scaling, especially if their range is significantly different from other features in the dataset.
- Skewed distributions: Features with highly skewed distributions often benefit from certain types of scaling or transformation to make them more normally distributed and improve model performance.
Why Scale Your Data?
Now, you might be wondering, "Why bother scaling at all? Can't we just let the data be?" Well, actually, many machine learning algorithms perform their best when all features are on a similar scale. Here's why scaling is needed:
- Equal Feature Importance: Unscaled features can accidentally dominate the model. For instance, wind speed (0–50 km/h) might overshadow temperature (10–35°C) simply because of its larger scale, not because it's more important.
- Faster Convergence: Many optimization algorithms used in machine learning converge faster when features are on a similar scale.
- Improved Algorithm Performance: Some algorithms, like K-Nearest Neighbors and Neural Networks, explicitly require scaled data to perform well.
- Interpretability: Scaled coefficients in linear models are easier to interpret and compare.
- Avoiding Numerical Instability: Very large or very small values can lead to numerical instability in some algorithms.
Now that we understand which and why numerical data need scaling, let's take a look at our dataset and see how we can scale its numerical variables using five different scaling methods. It's not just about scaling – it's about scaling right.
The Dataset
Before we get into the scaling techniques, let's see our dataset. We'll be working with data from this fictional golf club.

import pandas as pd
import numpy as np
from sklearn.preprocessing import MinMaxScaler, StandardScaler, RobustScaler
from scipy import stats

# Read the data
data = {
    'Temperature_Celsius': [15, 18, 22, 25, 28, 30, 32, 29, 26, 23, 20, 17],
    'Humidity_Percent': [50, 55, 60, 65, 70, 75, 80, 72, 68, 62, 58, 52],
    'Wind_Speed_kmh': [5, 8, 12, 15, 10, 7, 20, 18, 14, 9, 6, 11],
    'Golfers_Count': [20, 35, 50, 75, 100, 120, 90, 110, 85, 60, 40, 25],
    'Green_Speed': [8.5, 9.0, 9.5, 10.0, 10.5, 11.0, 11.5, 11.0, 10.5, 10.0, 9.5, 9.0]
}

df = pd.DataFrame(data)
This dataset is perfect for our scaling tasks because it contains features with different units, scales, and distributions.
Let's get into all the scaling methods now.
Method 1: Min-Max Scaling
Min Max Scaling transforms all values to a fixed range, typically between 0 and 1, by subtracting the minimum value and dividing by the range.
