Understanding Noisy Data and Uncertainty in Machine Learning
The fields of Artificial Intelligence and Machine Learning are hotter than ever. With models like Chat GPT and Stable Diffusion taking the world by storm, AI and ML hype has made a resurgence and is catching the attention of the masses. With all of this hype, it's important to remind ourselves who the governor of machine learning success is – high-quality data.
In the absence of quality training data, supervised machine learning models offer no utility. Unfortunately, most real-world data science projects fail because unrealistic expectations about model performance are made before the quality of the data source is fully understood. This article will attempt to provide intuition about noisy data and why machine learning models fail to perform. We will explore the nature of supervised learning and deterministic functions, different types of model uncertainty, and discuss methods for mitigating this uncertainty and managing expectations.
Supervised Learning Formulation
At its core, supervised machine learning is all about function approximation. We present a model with some inputs (X) and targets (y), and expect the model to approximate (or learn) a function that maps X to y by optimizing an objective function. More formally, the formulation for supervised learning looks something like this:

Given a data set (X, y), we assume the relationship between X and y is at least partially deterministic. The variance of the random error term, epsilon, plays a crucial role in the level of determinism of the function f(X). Higher variance in epsilon leads to an increasingly random and less predictable relationship between X and y. Contrary to how supervised learning is often taught, it's important to note that epsilon can be (and often is) a function of X. This means the amount of noise and corresponding model uncertainty varies across different regions of X.
To better understand the role of determinism and random errors, we will delve into the nature of deterministic functions, examining their characteristics and implications in machine learning.
Deterministic Functions
Deterministic functions have outputs that are fully specified by the inputs. This means, for every input in the domain, the function outputs exactly one unique quantity. These are the kinds of functions most of us have seen since our first course in Algebra:

In each example above, every input passed into the function produces a single output. Note that this does not mean the functions are defined for every possible number. For instance, function (4) is only defined for x1 > 0 and when the sum of x1 and x2 is not zero.
Visually, in one dimension, deterministic functions pass the "vertical line test" – this means if we draw a vertical line at any point in the domain, it will intersect the function at most one time:

Contrast this with a purely non-deterministic function. These are functions that can have multiple outputs for a single input.
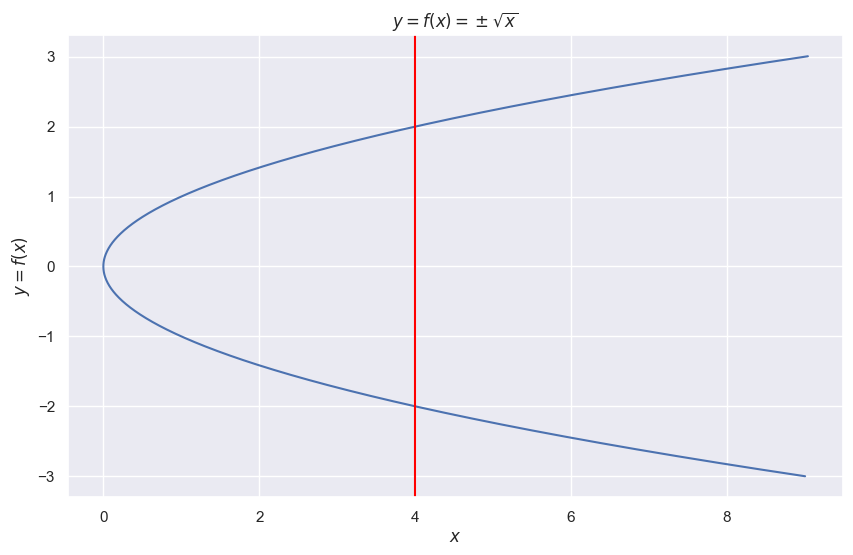
In the plot above, the vertical line through x = 4 intersects the curve at both -2 and 2. If someone asks us what f(4) is, we have to say it is either -2 or 2. In the most extreme case, a non-deterministic function could output infinitely many values for a single input.
As simple as the above non-deterministic function is to visualize and quantify, a machine learning model would never be able to learn it. To see this, suppose we sample the function as follows:

We'll use the above samples as the training set and fit a decision tree regressor:
import numpy as np
from sklearn.tree import DecisionTreeRegressor

# Create the training set for the function y = +- sqrt(x)
y_train = np.random.normal(0, 20, 100)
x_train = y_train**2

# Fit a decision tree regressor to the training data
model = DecisionTreeRegressor()
model.fit(x_train.reshape(-1, 1), y_train)

# Create the test set for the function y = +- sqrt(x)
y_test = np.random.normal(0, 20, 100)
x_test = y_test**2

# Make predictions on the test set
preds = model.predict(x_test.reshape(-1, 1))
We can visualize how well the model performed on a test set:

The decision tree is essentially guessing on the test set. Because each non-zero input in the domain maps to two different values, a machine learning model has no way of knowing which value to predict on a test set. Noise in the training data due to the nature of the underlying function will cause any machine learning model to make predictions with high uncertainty.
Sources of Uncertainty
Now that we've seen the difference between deterministic and non-deterministic/random functions, let's explore the types of uncertainty that can arise from trying to learn these functions.
Data (Aleatoric) Uncertainty
Data uncertainty, also known as aleatoric uncertainty, comes from the inherent complexity of the observed data set. In a classification setting, this often presents itself as overlapping classes. For instance, the following scatter depicts overlapping classes in two dimensions:

For most observations in a neighborhood of (x1, x2), there's no obvious way to distinguish between the two classes. And while it is true that a sufficiently complex classifier could perfectly classify the examples in the data set above, that same classifier would likely not perform better than random guessing on a test set.
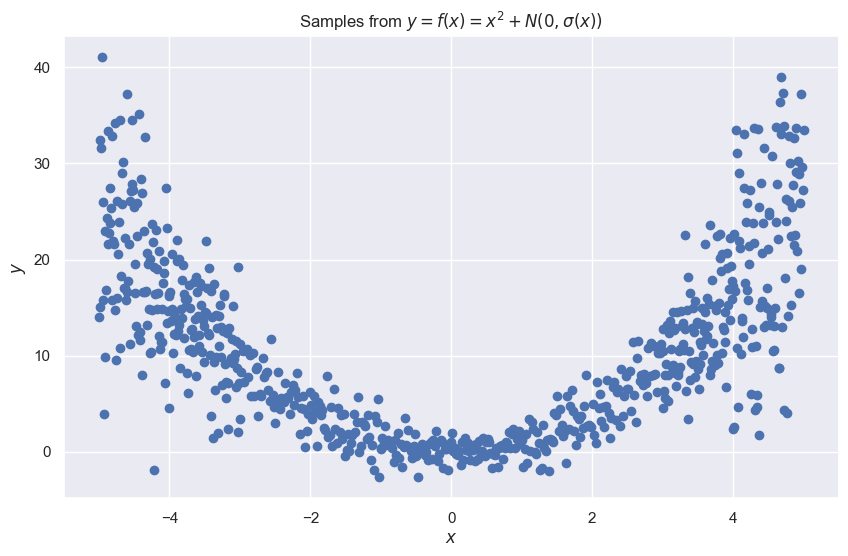
In a regression setting, data uncertainty often results from additive noise in the underlying data. Data uncertainty would arise from a data set that looks something like this:

In this case, x is the only feature considered, and for any neighborhood of x, y takes on many possible values. For example, if we try to predict the value of y when x = 0 based on the data, no obvious answer stands out. In general, the higher the variance of the additive noise distribution, the more data uncertainty there will be.

As discussed earlier, it's common to see noise levels and data uncertainty vary across regions of the domain. Data uncertainty is often higher towards the edges of the domain, as illustrated below:
Data uncertainty usually manifests when critical features are left out of the model. To illustrate this, consider the following data set where we want to use x1 to predict y:

If only x1 is used as a feature to predict y, no machine learning model would stand a chance of performing well. For instance, when x1 = -0.49, y takes on 14 different values in this data set. In the absence of other features, predicting y looks hopeless. However, the above data set is actually a sample from the following function:

If we take samples from x2, and visualize x1, x2, and y in three dimensions, a clear surface appears:

The relationship between x1 and y is noisy and would result in high data uncertainty by any model that attempted to learn it. However, the relationship between (x1, x2) and y has no noise because it is fully determined by a closed-form equation. Given enough training data, a sufficiently non-linear model could learn this relationship with no data uncertainty.
Many financial applications encounter data uncertainty because many unobserved human behaviors affect markets. For instance, countless factors influence whether an individual will default on a loan. Even if two loan recipients have the same credit profile and look identical in feature space (most financial institutions have a large number of features to work with), there's still a possibility that recipient A defaults because of a life emergency while recipient B doesn't. Unless the default model is exposed to data that predicts life emergencies, there will always be an element of data uncertainty in these scenarios.
Knowledge (Epistemic) Uncertainty
Knowledge (epistemic) uncertainty results from data that is sparsely sampled in certain regions of the domain. Consider the following data set where we would like to model the relationship between x and y:

This data set presents no information about y when x takes on values between 1 and 3 or between 4 and 7. A machine learning model would have to make a blind guess when predicting the value of y in those regions. Fortunately, unlike data uncertainty, knowledge uncertainty can be reduced by sampling regions of missing data. If we fully sample the domain, the relationship between x and y becomes clear:

Knowledge uncertainty is common in practice because most data sets are not sampled from uniform distributions, naturally resulting in sparse regions of the domain. In general, the more uniformly sampled the domain is, the less knowledge uncertainty there will be in the modeling process.
Methods for Handling Noisy Data and Uncertainty
Now that we've gained some intuition about the nature of noisy data and uncertainty, let's explore some practical actions that can be taken the combat the issue.
1. Stop Trying to Find Better Models
Failing fast and knowing when to move on are invaluable data science skills. We live in a time where state-of-the-art, highly performant models exist for almost any machine learning problem. Any data scientist stuck in the model selection or hyperparameter tuning process with suboptimal results should look elsewhere for performance gains. In other words, the model probably doesn't need to be improved, the data does.
2. Get More Data
As we saw earlier, poor-performing models are usually the result of incomplete data. Even a feature that appears unimportant in isolation can add significant predictive power when accompanied by more features. Because of this, data scientists must ensure they have a complete understanding of the problem and the data sources needed for successful modeling. Acquiring the right data and engineering good features is arguably the most difficult yet critical part of a data scientist's job. A data scientist should be able to work with stakeholders on balancing the costs and benefits of getting more data, since this is ultimately where the most Business value will come from.
3. Quantify Uncertainty in Model Predictions
For high stakes Machine Learning problems where noisy data is unavoidable, it's often valuable for a model to quantify the uncertainty in a prediction. Calibrated classifiers provide uncertainty estimates in their predicted probabilities that can be more useful than the predicted class. In regression, methods like quantile regression, conformal prediction , bayesian neural networks, and natural gradient boosting can be leveraged to generate uncertainty estimates. In short, having a model capable of saying "I don't know" when making a prediction can be incredibly valuable.
4. Manage Expectations
As a data scientist, it is crucial to remember that machine learning is a tool to achieve a specific goal and should be used with a clear understanding of the underlying business problem. Having a comprehensive understanding of the problem, and the role of machine learning in solving it, allows for more accurate expectations to be set for the performance of the model, ultimately leading to more effective and efficient use of the tool. This will help in developing a machine learning model that is tailored to the specific needs of the business, delivering the best results. Machine learning is a means to an end. Having a perfect model isn't usually required to solve a problem, but correctly utilizing imperfect models is.
Become a Member: https://harrisonfhoffman.medium.com/membership
Like my articles? Buy me a coffee: https://www.buymeacoffee.com/HarrisonfhU
References
- Estimating Uncertainty with Catboost – https://catboost.ai/en/docs/references/uncertainty
